


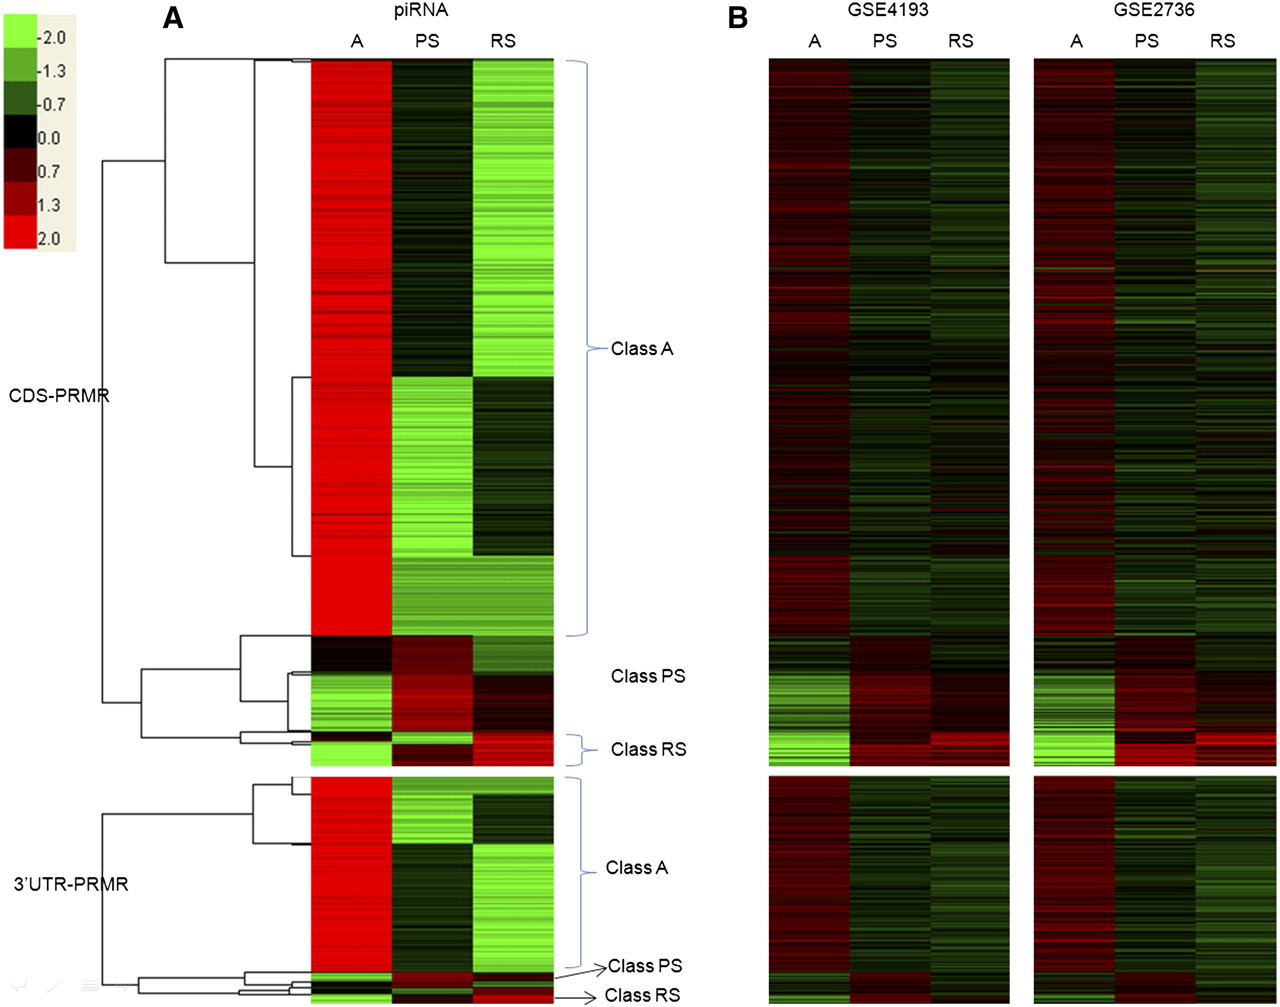
FIGURE 5.
Heat maps of piRNA and mRNA expression profiles of CDS-PRMRs and 3′UTR-PRMRs. (A) Heat map of piRNA expression profiles of PRMRs. Expression intensities are displayed from green (low expression) to red (high expression). Expression profiles are clustered using hierarchical clustering. Data were visualized with Treeview. According to the clustering results, the CDS-PRMRs and 3′UTR-PRMRs were divided into three groups (Class A, PS, and RS), respectively. (B) Heat map of mRNA expression profiles of PRMRs according to GEO data sets GSE4193 and GSE2736. The order of rows is the same as in A.




