


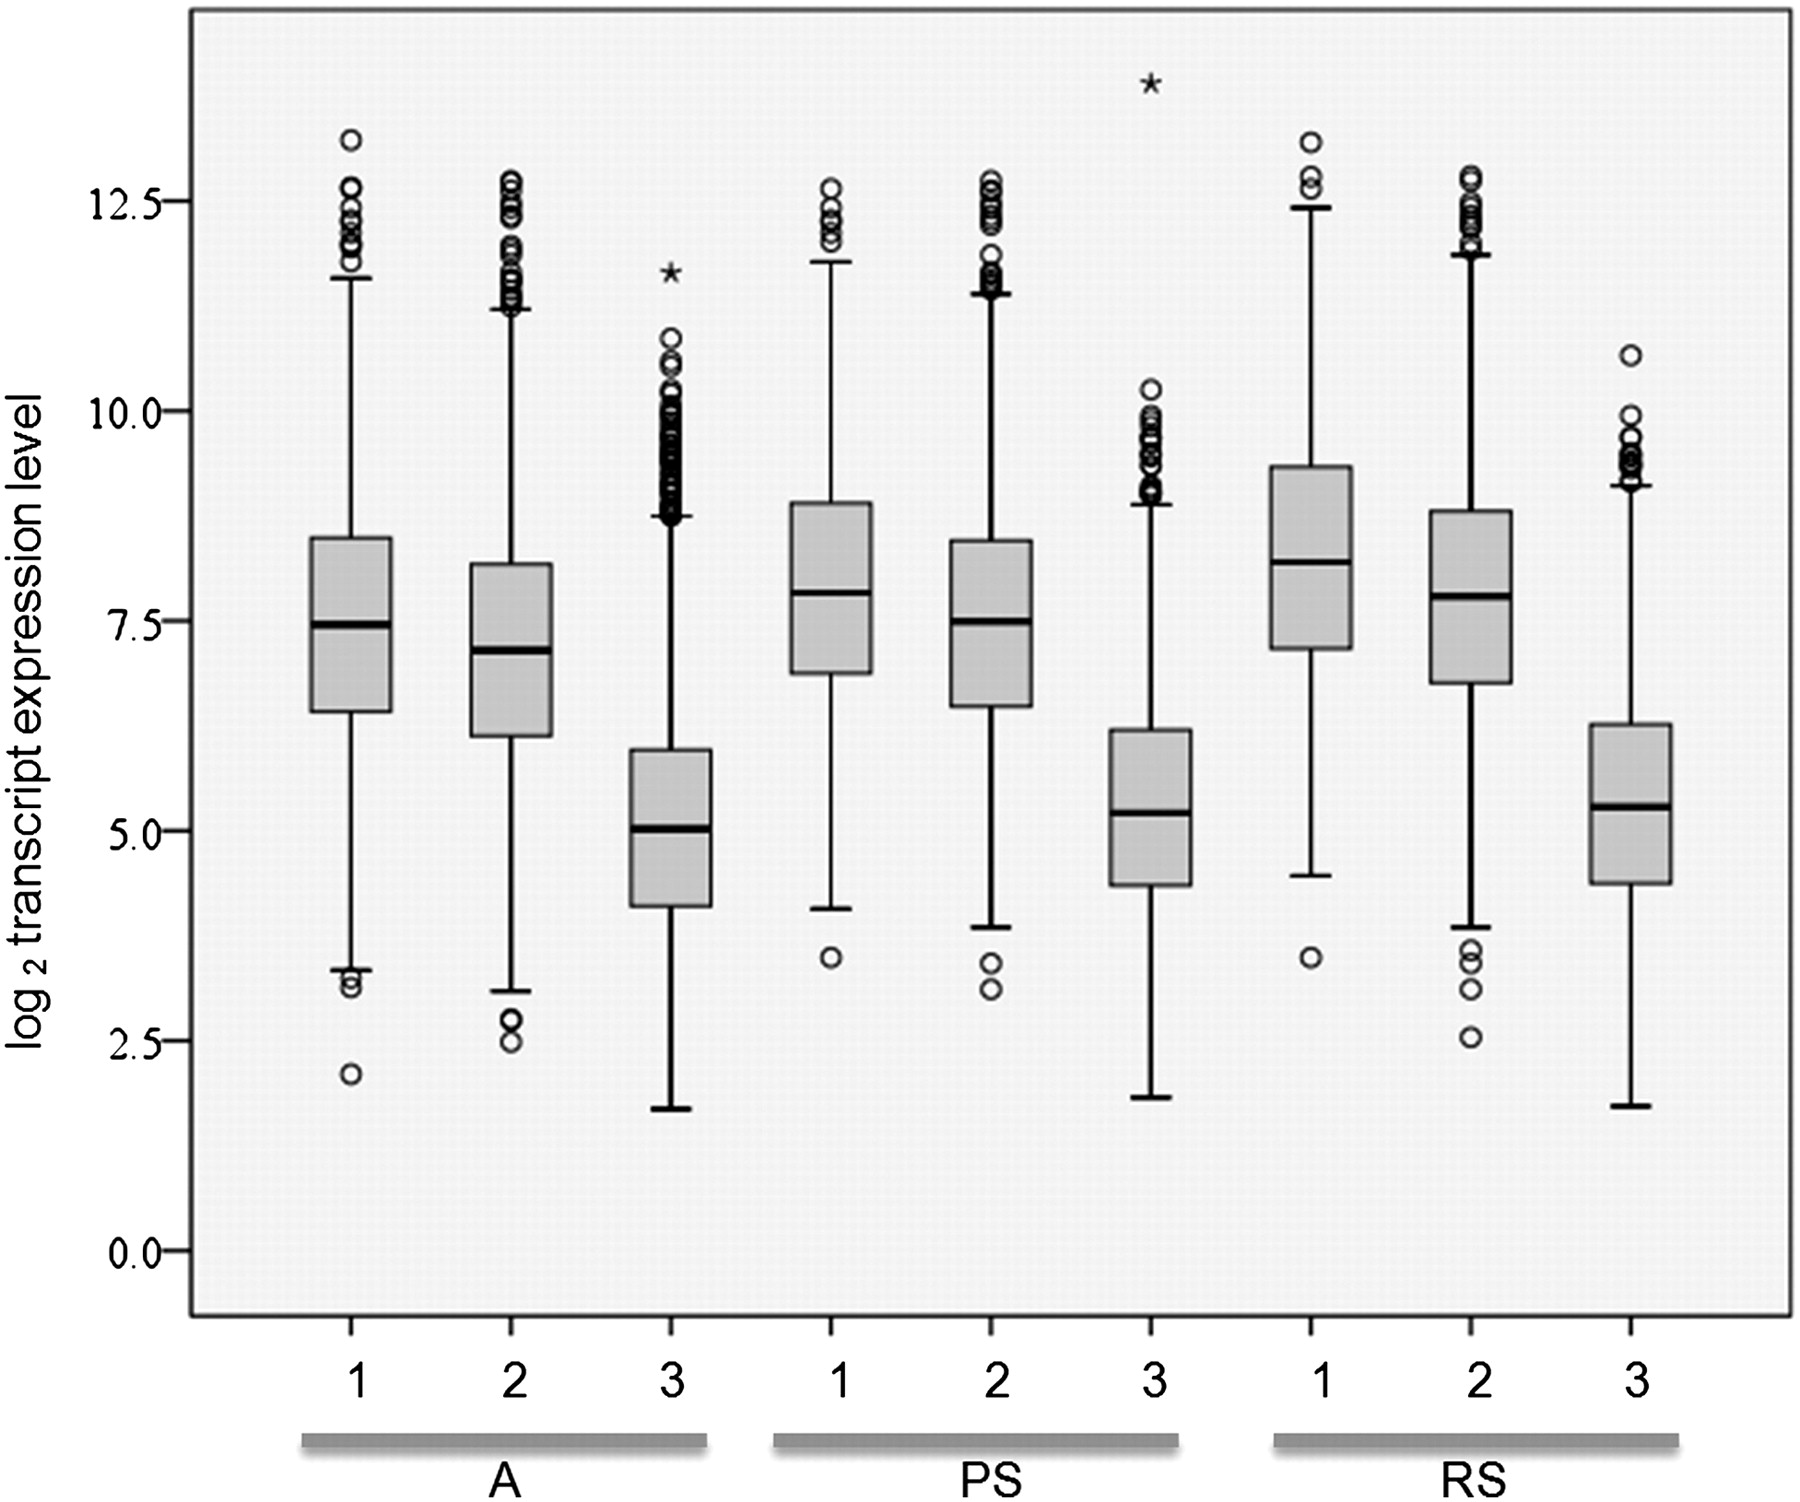
FIGURE 4.
Box plot of the expression levels of splicing isoforms of PRMRs in three cell types: (1) PRMRs without isoforms; (2, 3) the two isoforms that contain the highest and lowest number of piRNAs. Splicing isoforms of 1, 2, and 3 were identified from the mouse testis exon expression data set GSE15998, and the expression levels were plotted using the SPSS software.




