


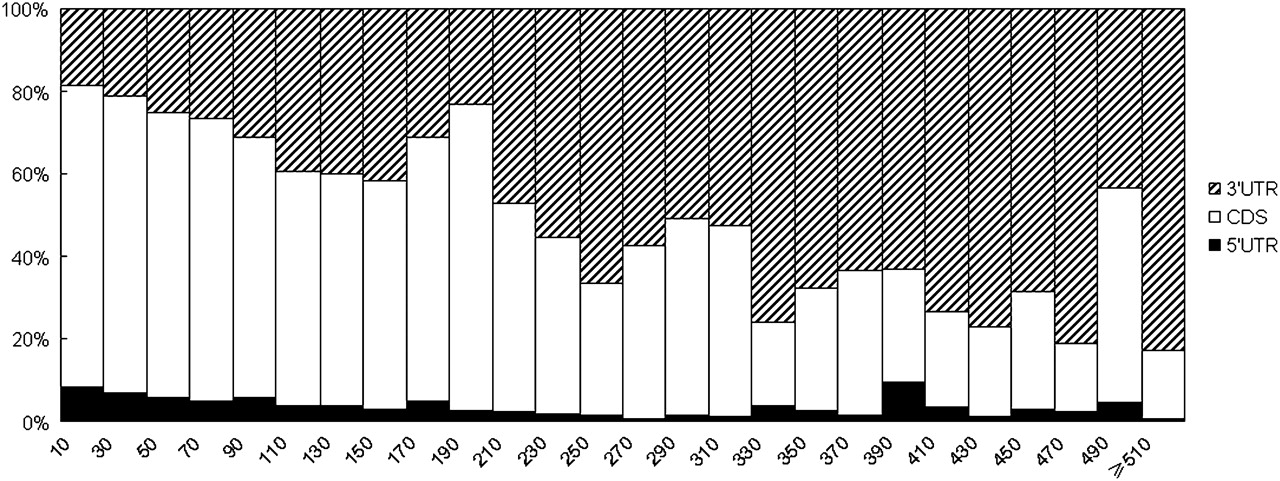
FIGURE 2.
Distribution of piRNAs in 5′ UTR, CDS, and 3′ UTR regions as a function of the abundance of piRNAs in PRMRs. PRMRs were sorted and grouped according to the number of piRNAs that they contain. The group interval was 20. The percentages of piRNAs in the three regions were plotted for each group. As can be seen, piRNAs tend to map to 3′ UTR as their abundance increases.




