


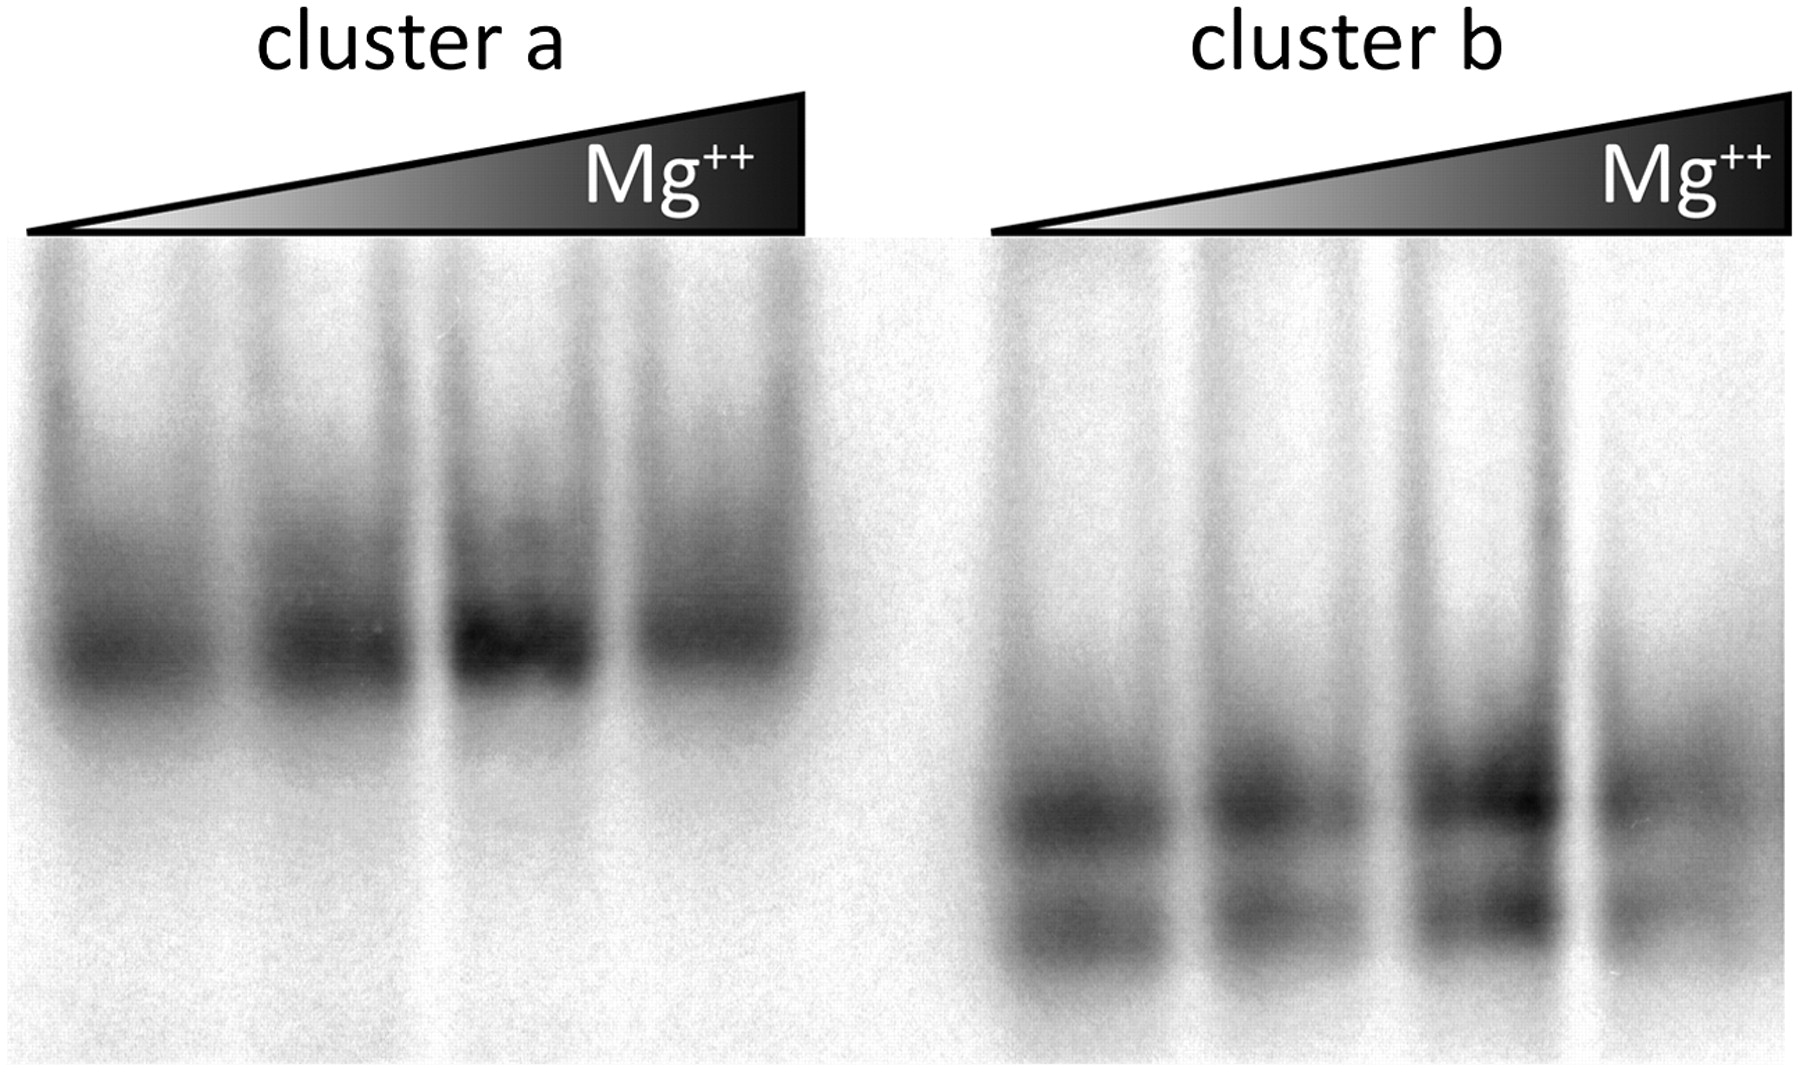
FIGURE 7.
Nondenaturing 8% polyacrylamide gel of in vitro folded cluster a and cluster b sequences from Figures 5 and 6 (see Materials and Methods). Final Mg++ concentrations are 0, 5, 10, and 15 mM. Two bands are apparent in the clade b samples: slower and faster migrating products that account for 57% and 43% of the integrated band intensity, respectively.




