


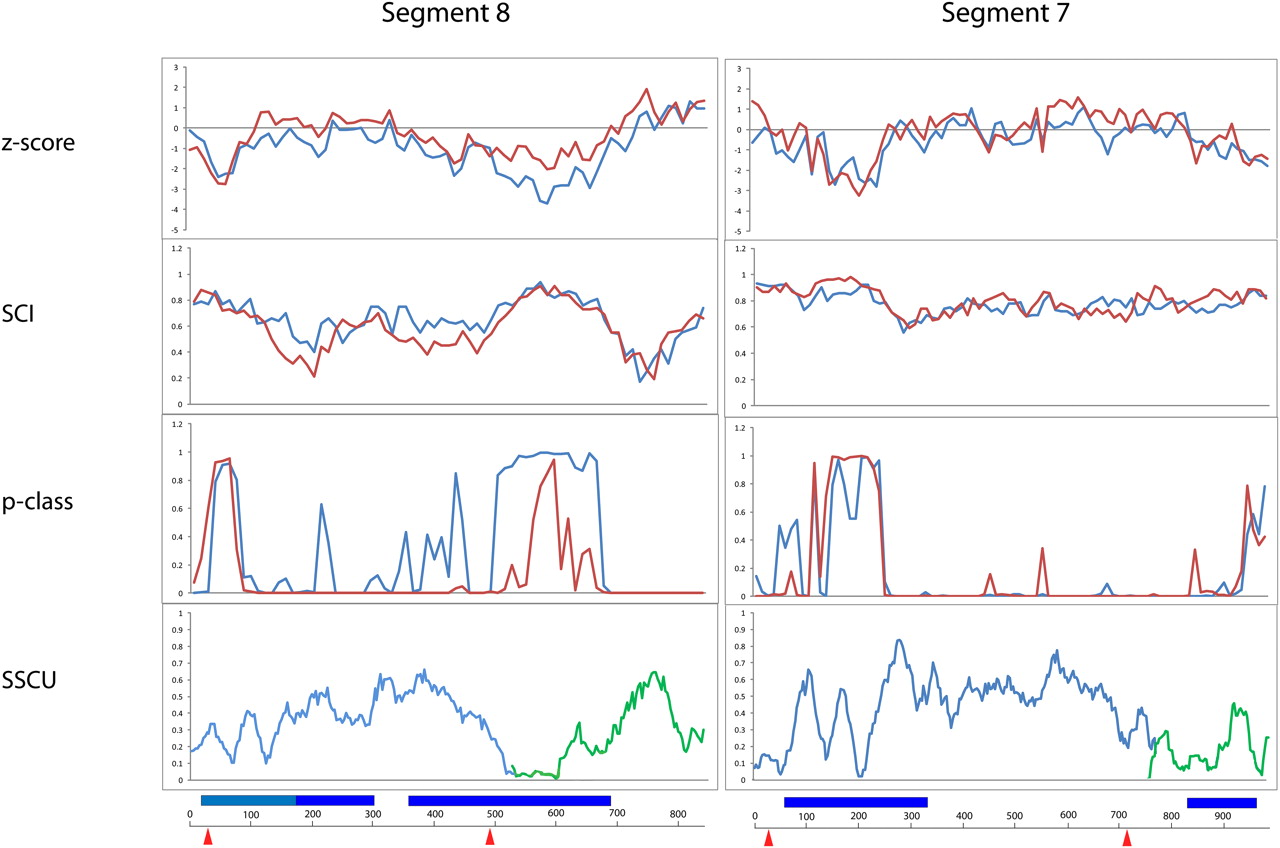
Results of RNAz calculations and suppression of synonymous codon usage (SSCU) studies for coding regions of segments 8 and 7. (Red lines) (−)RNA; (blue lines) (+)RNA. The first plot gives the calculated Z-score, which is a measure of the “excess” free energy of folding a native RNA sequence vs. random sequence. The second plot gives the structure conservation index (SCI), which indicates how well represented the consensus structure is in predictions of individual sequence secondary structures (y-axis indicates the fraction of conservation). The third plot shows the RNAz probability (p-class) of the presence of conserved structural RNA. The bottom panel shows the results for the SSCU calculations, which measure the variation at the third codon position (y-axis gives the distance at the third codon position). Here, low distance/variation indicates strong SSCU. Results for the larger ORF (blue) and the smaller (green). (Below the bottom panel) The common x-axis indicates the input alignment position in nucleotides. (Dark blue bars) Overlapping RNAz predictions clearly in the (+) sense; (light blue bars) RNAz predictions with ambiguous strand bias; (red arrows) the splice sites.




