


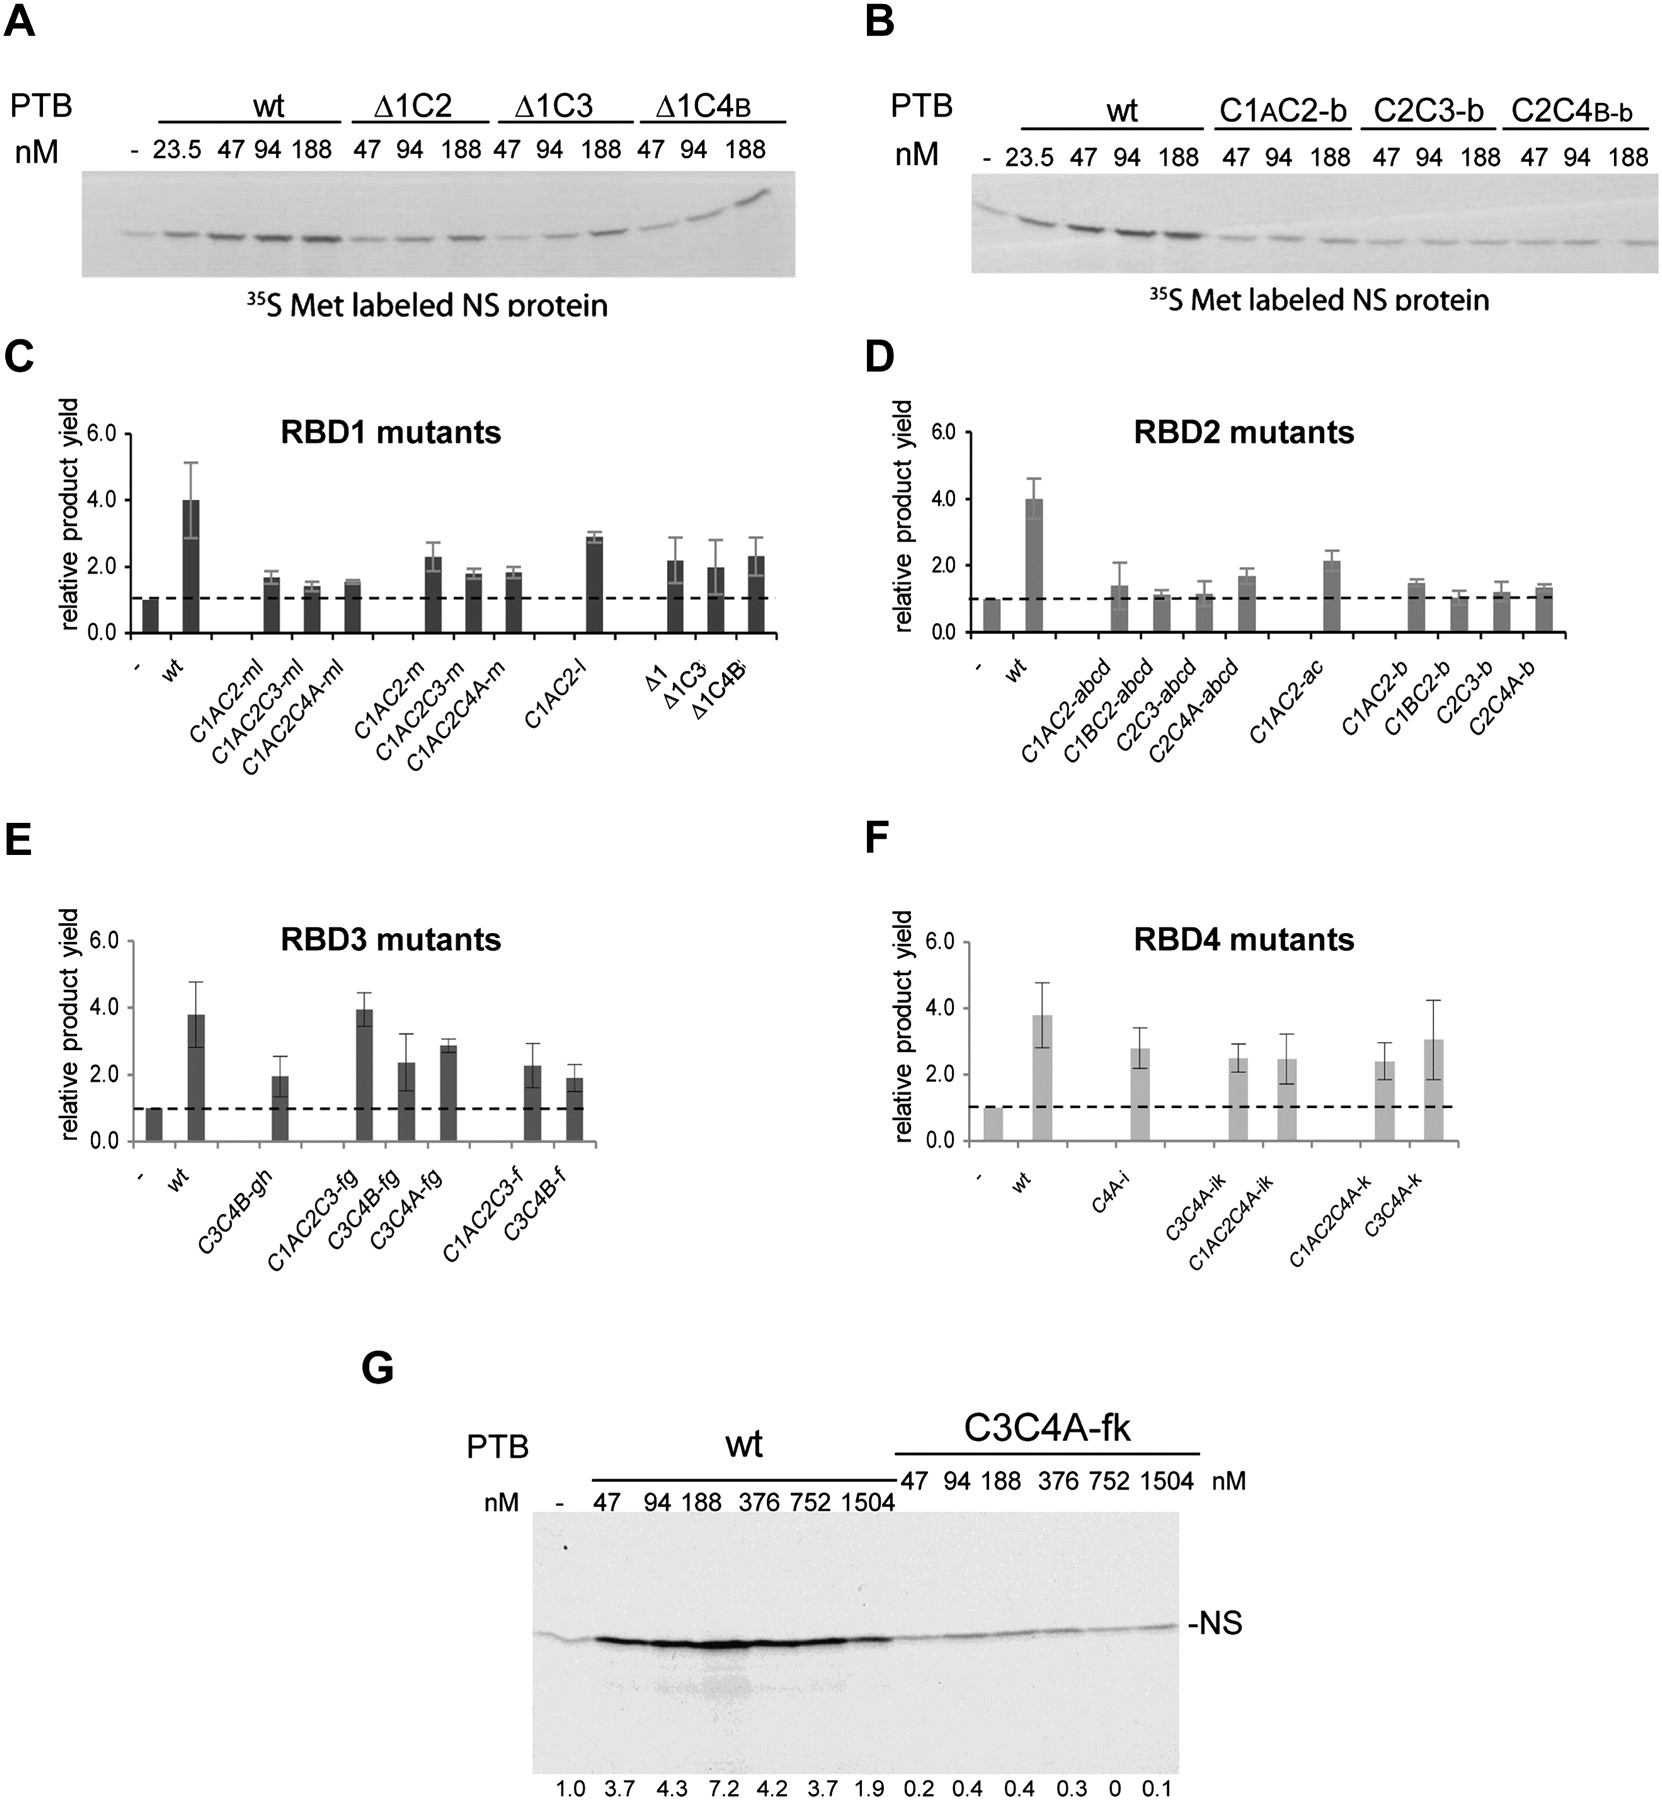
Translation assays of the stimulation of EMCV IRES activity by PTB′ derivatives with mutations in the RNA-binding surface of each RBD. (A,B) Representative autoradiographs showing the translation products synthesized in the presence of various concentrations of the wild-type full-length PTB-1 control (WT) and the designated PTB′ mutants. (C–F) Summary of translation assay results for the designated mutants of RBD1 (panel C), RBD2 (panel D), RBD3 (panel E), and RBD4 (panel F). The maximum translation product yield obtained with each mutant was compared to the yield observed when no PTB was added to the translation reaction (−PTB; set at 1.0 and shown by the dashed horizontal line). The results shown are the mean (with standard deviation) of the values obtained for each mutant in three independent experiments. (G) Assay of wild-type full-length PTB (WT) and the C3C4A-fk PTB′ derivative with inactivating mutations in both RBDs3 and 4. Translation products were analyzed by SDS-PAGE, and the resulting autoradiograph is shown. The concentration of added wild-type PTB or C3C4A-fk PTB′ in the assays is given above each lane, and the numbers below each lane show the actual stimulation (i.e., the increment) in translation product yield expressed relative to the yield (assigned a value of 1.0) in the control assay lacking any added PTB or PTB′. The PTB-depleted lysate used for this experiment was a different batch from that used for panels A–F, and the depletion was likely to have been more efficient, resulting in a greater stimulation.




