


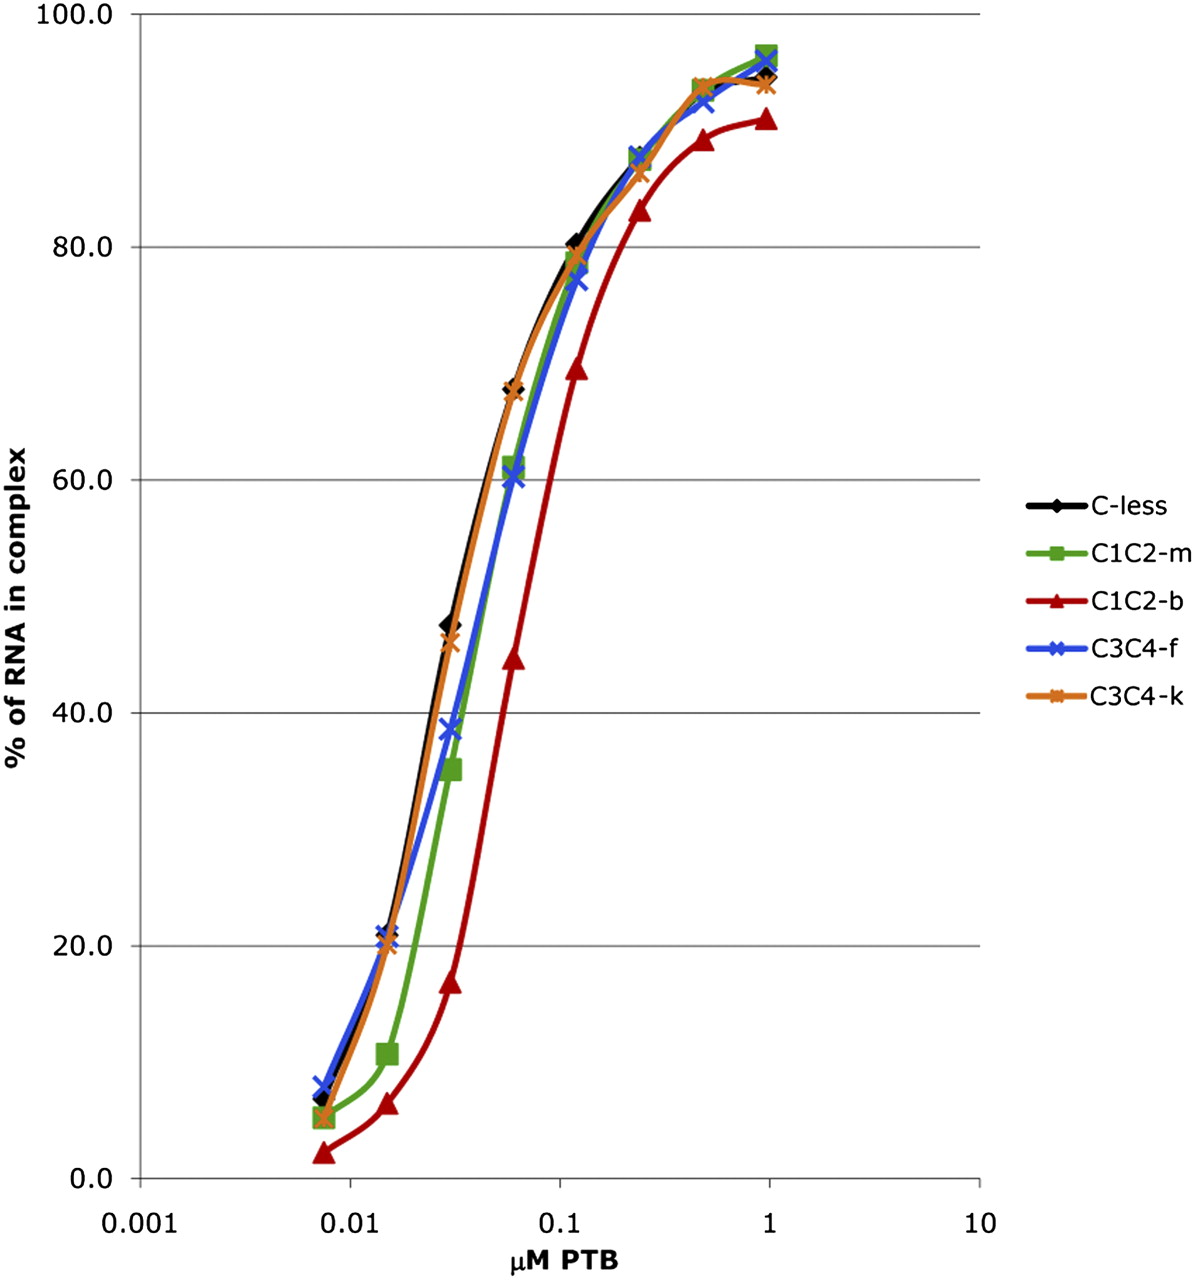
FIGURE 5.
Filter-binding assays of the interaction of various PTB′ derivatives with the full-length EMCV probe. The assay was performed in triplicate as described in Materials and Methods. The average values for the fraction of RNA bound to PTB′ are plotted against the concentration of PTB′ derivative, which is plotted on a log10 scale. For clarity, error bars have been omitted, and instead the standard deviations for the calculated Kd values are given in the text.




