


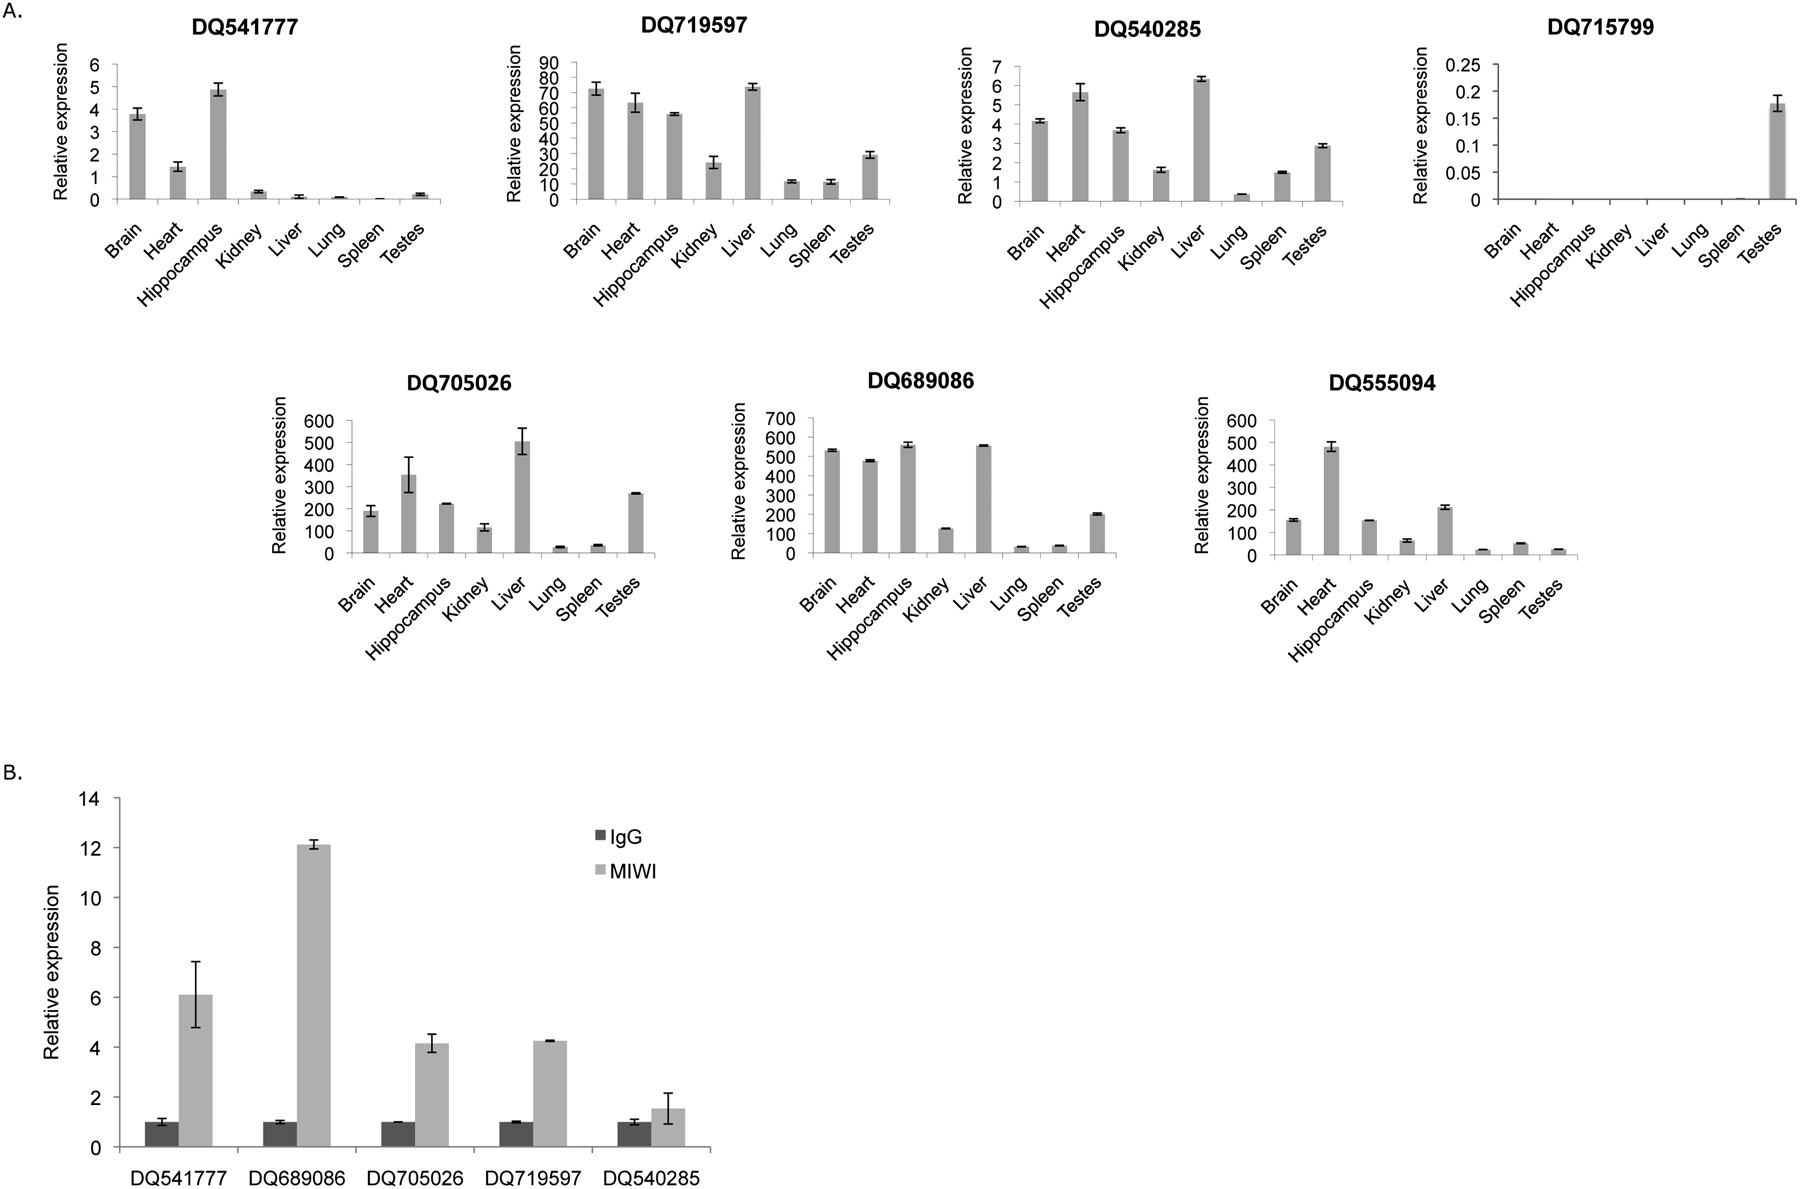
FIGURE 2.
Analysis of piRNA expression and their association with piRNPs. (A) Real-time PCR expression in mouse tissues. Data were normalized by U6 small RNA and further multiplied by 1010 for the simplicity of the data presentation. DQ715799 is used as negative control. Amounts are represented as mean ± SD. (B) Real-time PCR expression of piRNA after immunoprecipitation with MIWI antibody. Association of five piRNAs with MIWI was measured after immunoprecipitation by real-time PCR. Amounts of immunoprecipitated piRNAs (light gray) were normalized with IgG (dark gray). Amounts are represented as mean ± SD.




