


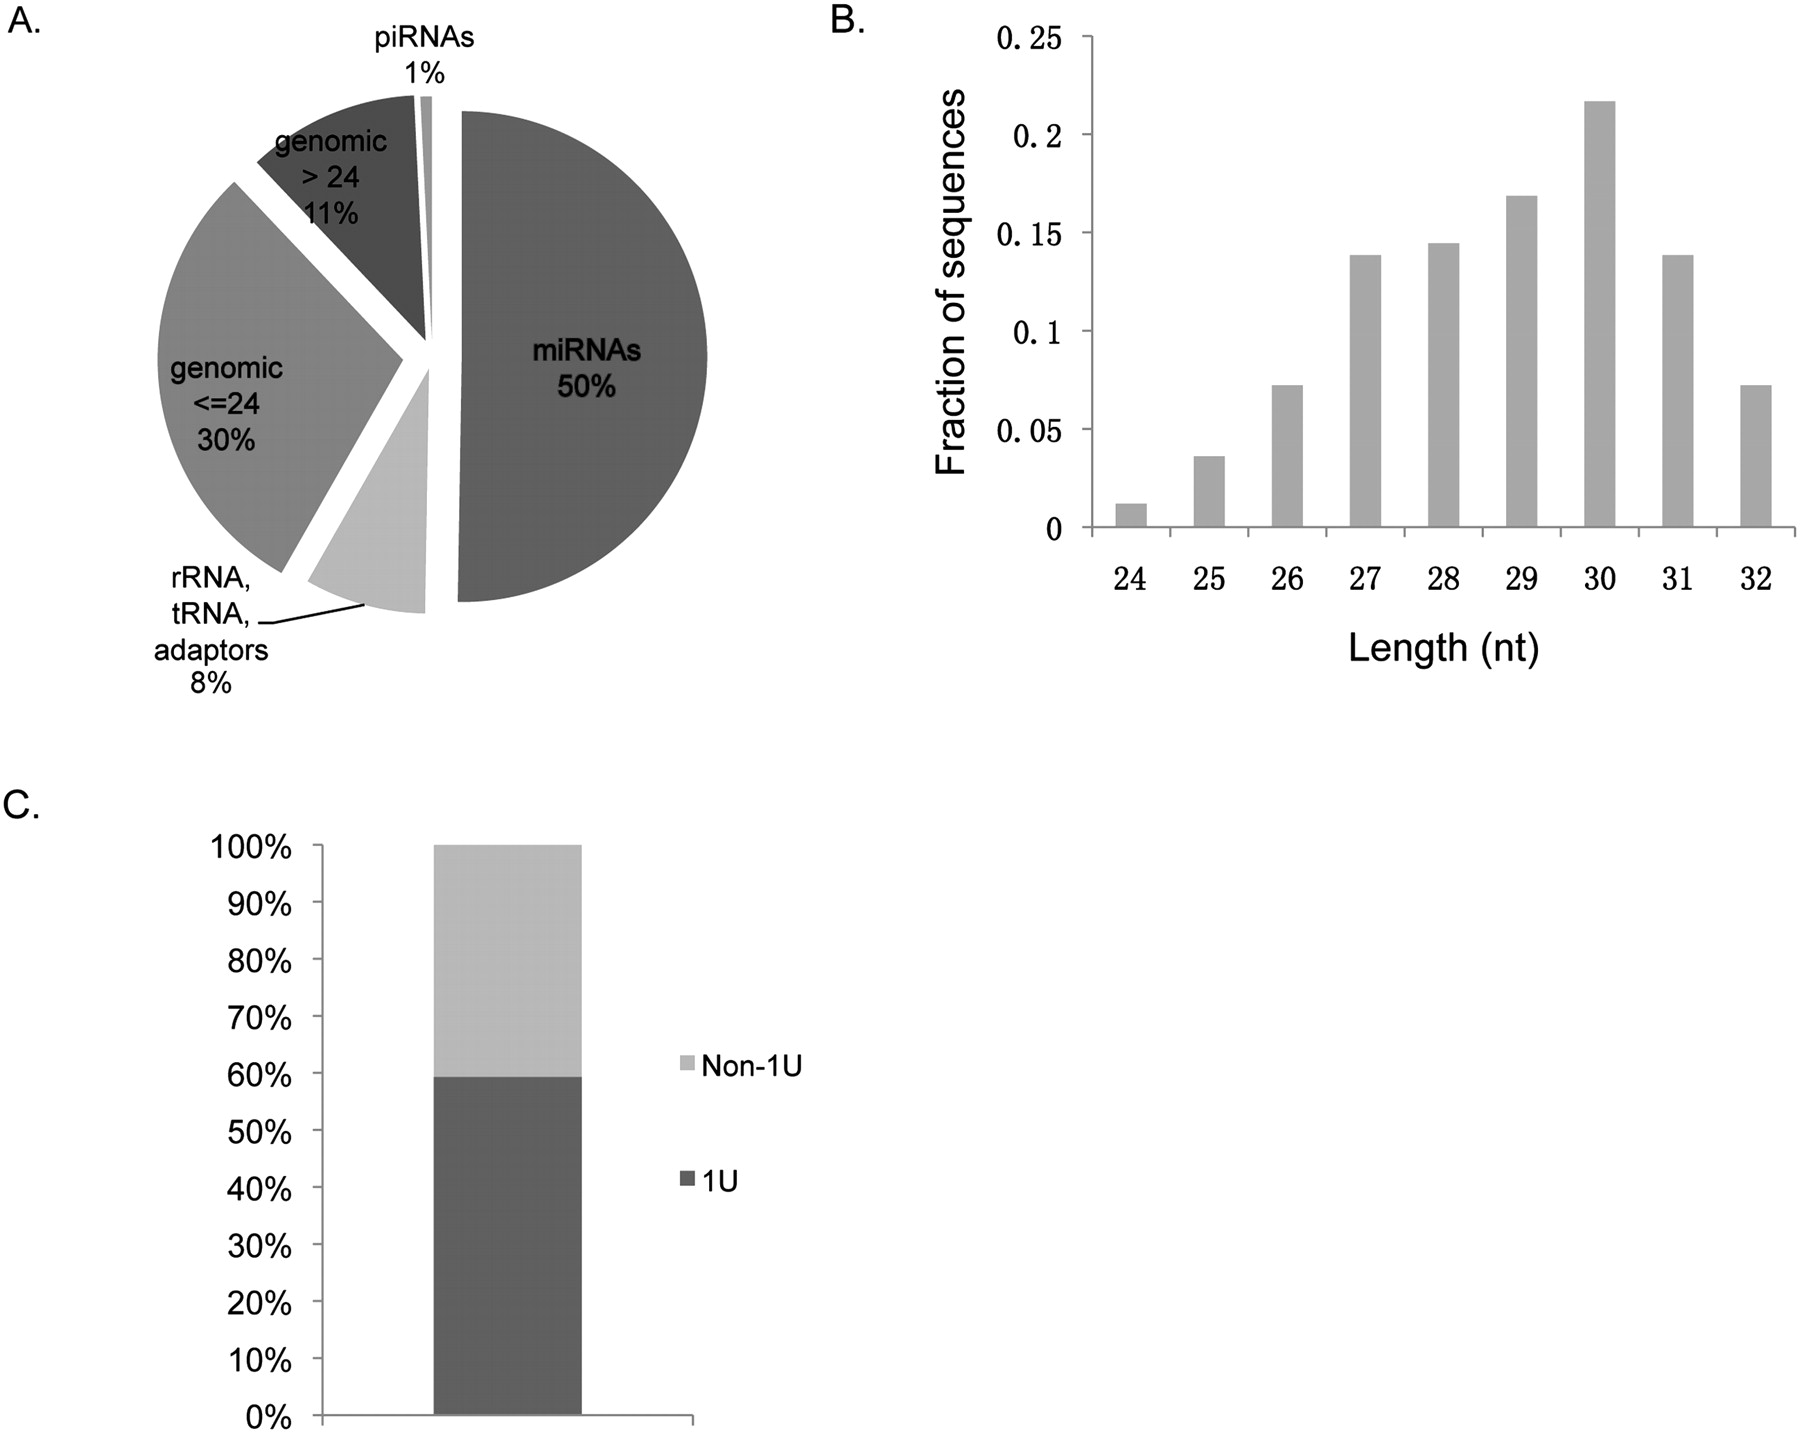
FIGURE 1.
Sequencing mapping. (A) Small RNA mapping data. Approximately 50% of small RNA is mapped to miRNA; ∼30% of small RNA is <24 nt, which could be novel miRNA, endogenous siRNA, or other small RNA; ∼11% of small RNA is mapped to sequences longer than 24 nt; and ∼1% is mapped to known piRNA sequences. (B) Size distribution of piRNAs in mouse hippocampus. piRNA with more than five tags are counted, and their size ranged between 25 and 32 nt. (C) Nucleotide bias of piRNA. Approximately 60% of piRNAs show that the first nucleotide is U.




