


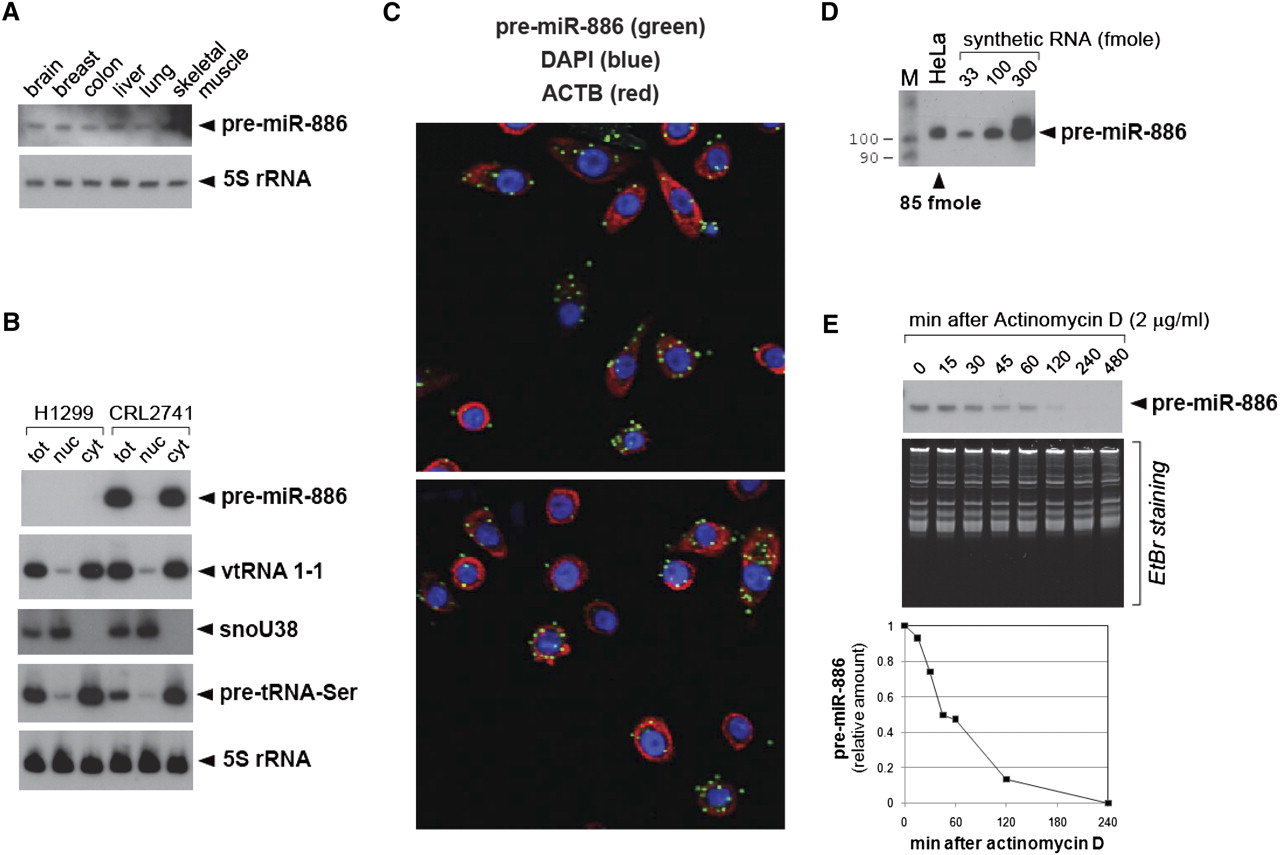
The tissue expression, intracellular localization, copy number, and half-life of pre-miR-886. (A) Northern hybridization of pre-miR-886 in tissue RNAs. All other descriptions are the same as in Figure 1D,F. (B) Northern hybridization of pre-miR-886 and vtRNA1-1 in total (tot), nuclear (nuc), and cytoplasmic RNA (cyt). The quality of fractionation was verified using the nuclear marker snoU38 (Terns et al. 1995) and the cytoplasmic marker precursor tRNA-Ser (Lee et al. 2009). 5S rRNA is a loading control. (C) In situ detection of pre-miR-886 (green), together with DAPI staining (blue) and ACTB mRNA detection (red) for nuclear and cytoplasmic staining, respectively. Two representative fields are shown. (D) Northern hybridization of pre-miR-886 in the total RNA from 5 × 10⁵ HeLa cells and indicated amounts of in vitro transcribed pre-miR-886. The lane “M” is the molecular size marker (as described in Fig. 1D). Each band was quantified with AlphaView software 2.0.1.1 (Alpha Innotech Corp.). A regression line was drawn using the values of the in vitro transcribed pre-miR-886 to estimate its intracellular amount in HeLa. Our calculation yielded 85 fmol of pre-miR-886 per 5 × 10⁵ HeLa cells, which equals ∼105 copies per cell. (E) Northern hybridization of pre-miR-886 after treatment with actinomycin D, an inhibitor of transcription (top panel). EtBr (ethidium bromide) staining of total RNA is shown for equal loading. Each band was quantified as described in panel D, normalized to the intensity of the corresponding EtBr signal, and plotted (bottom panel). The value at time 0 was set as 1. The half-life of pre-miR-886 was estimated to be 45–60 min.




