


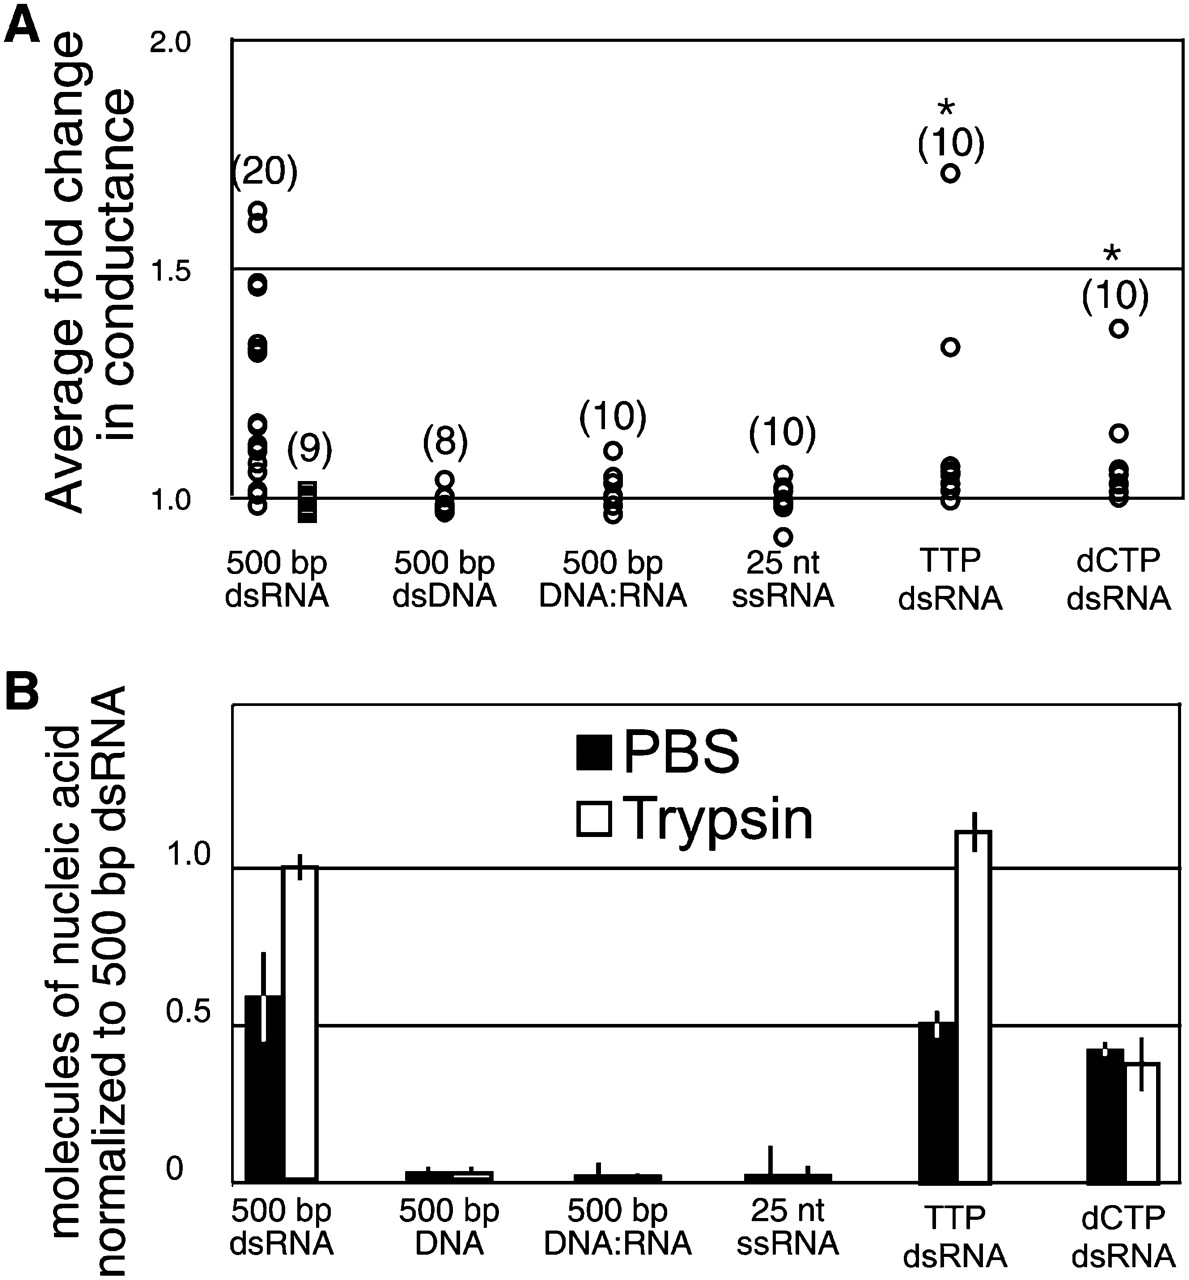
Specificity of SID-1 activation, transport, and retention. (A) Summary of normalized conductance change of SID-1(WT) (circles) or SID-1(S536I) (squares) expressing cells in response to the addition of the indicated nucleic acids. The normalized fold change in membrane conductance was calculated from the average conductance of 10 consecutive time points after dsRNA addition divided by the average conductance of 10 consecutive time points before dsRNA addition. The magnitude of the conductance change following addition of dsRNA was variable from cell to cell, likely reflecting relative SID-1 expression levels in these transiently transfected cells. The measured conductance for S2 cells ranged from 2.5 to 17 μS (microSiemens) in the absence of dsRNA and 3.5–25 μS in the presence of dsRNA, likely reflecting the variability in cell size. *P < 0.001 (Kologonov-Smirnoff test) for all results compared to SID-1(S536I) cells exposed to 500-bp dsRNA. (n) Number of patched cells. (B) Summary of transport and retention properties for the indicated nucleic acids. SID-1 expressing S2 cells soaked in radiolabeled dsRNA were washed extensively in PBS buffer before (PBS) or after (trypsin) trypsin protease treatment. In order to increase assay sensitivity 5 ng/mL of nucleic acid was used instead of the standard 10 ng/mL. Error bars = 1 standard deviation; P < 0.005, Student's t-test.




