


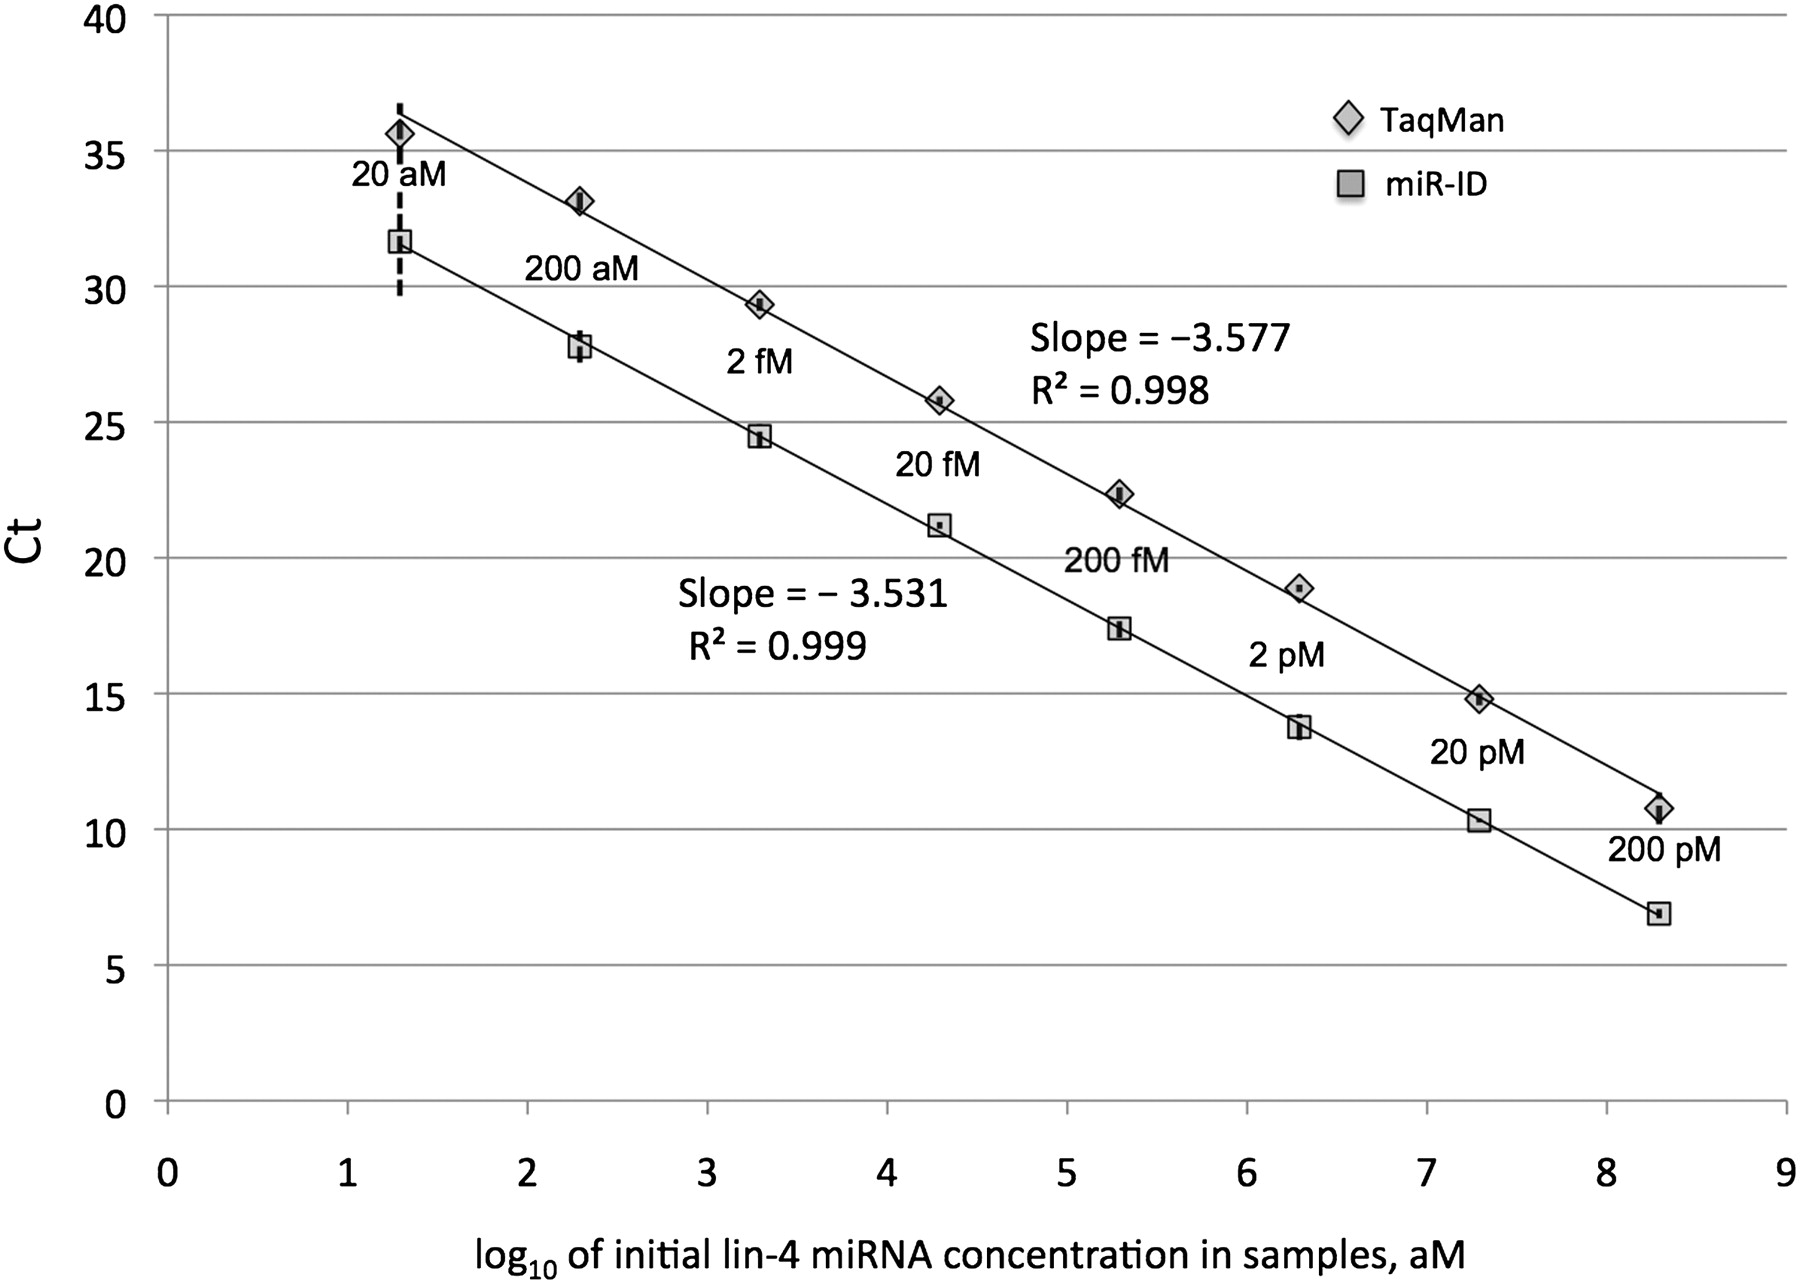
FIGURE 6.
Side-by-side comparison of sensitivity, detection limit, and dynamic range for the miR-ID and TaqMan microRNA assays. Standard curves for both assays were generated for a dilution series from 200 pM to 20 aM of synthetic lin-4 miRNA for either the miR-ID and the TaqMan assays. The data for the TaqMan assay correspond closely to the previously reported standard curve (Chen et al. 2005), taking into account that in the latter publication the concentrations of lin-4 (1.3 aM to 13 pM) represented inputs into the PCR reactions rather than inputs into RT reactions as shown here.




