


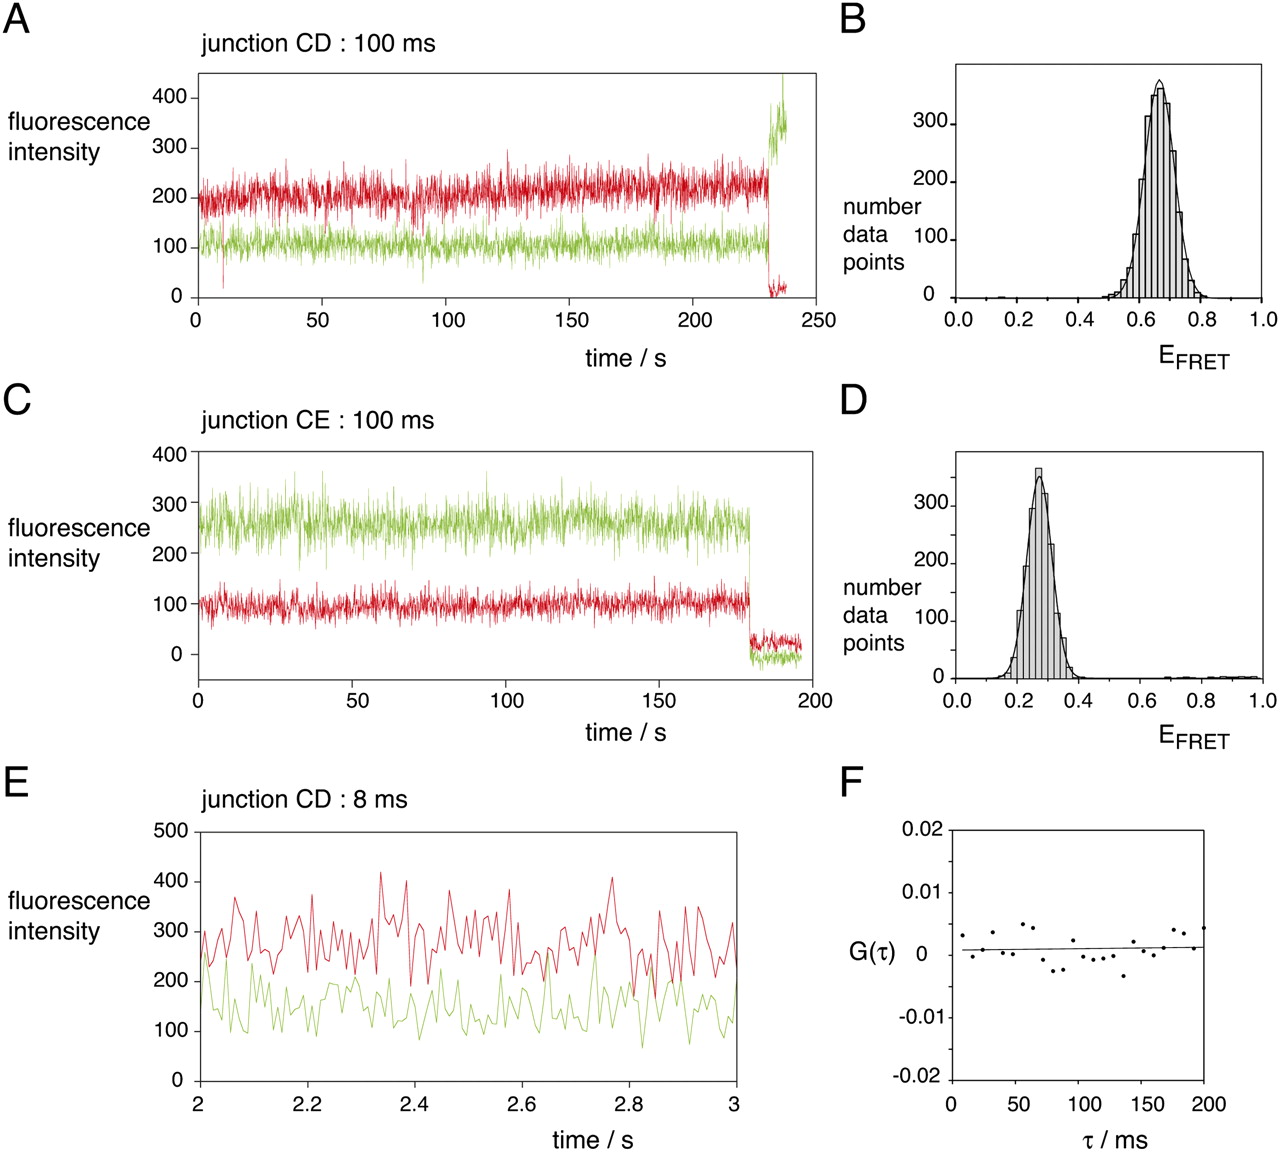
Seeking conformational transitions in single-junction molecules. The CD and CE vectors (the same species used in Figure 5) were separately encapsulated in phospholipid vesicles in 10 mM Tris-HCl (pH 8.1), 50 mM NaCl, 10 mM MgCl2, and imaging buffer, and studied by total internal reflection microscopy. Representative long time records at 100-msec time resolution are shown for the CD and CE vectors (A and C, respectively) up to the point at which fluorophore photobleaching has occurred. Histograms of EFRET for the individual CD and CE molecules are also presented as plots B and D, respectively, for the unbleached sections of the time records. Note that no transitions can be detected over these long time traces. The same preparation of CD vector was also studied at 8-msec time resolution. A 1-sec section of a time record is presented (E). Close examination of this (and many other traces not shown) fails to reveal anti-correlation between Cy3 and Cy5 fluorescence intensity. This is confirmed by performing a cross-correlation analysis on a 4-sec time record (F). The data fit a linear function with no decay, passing through zero.




