


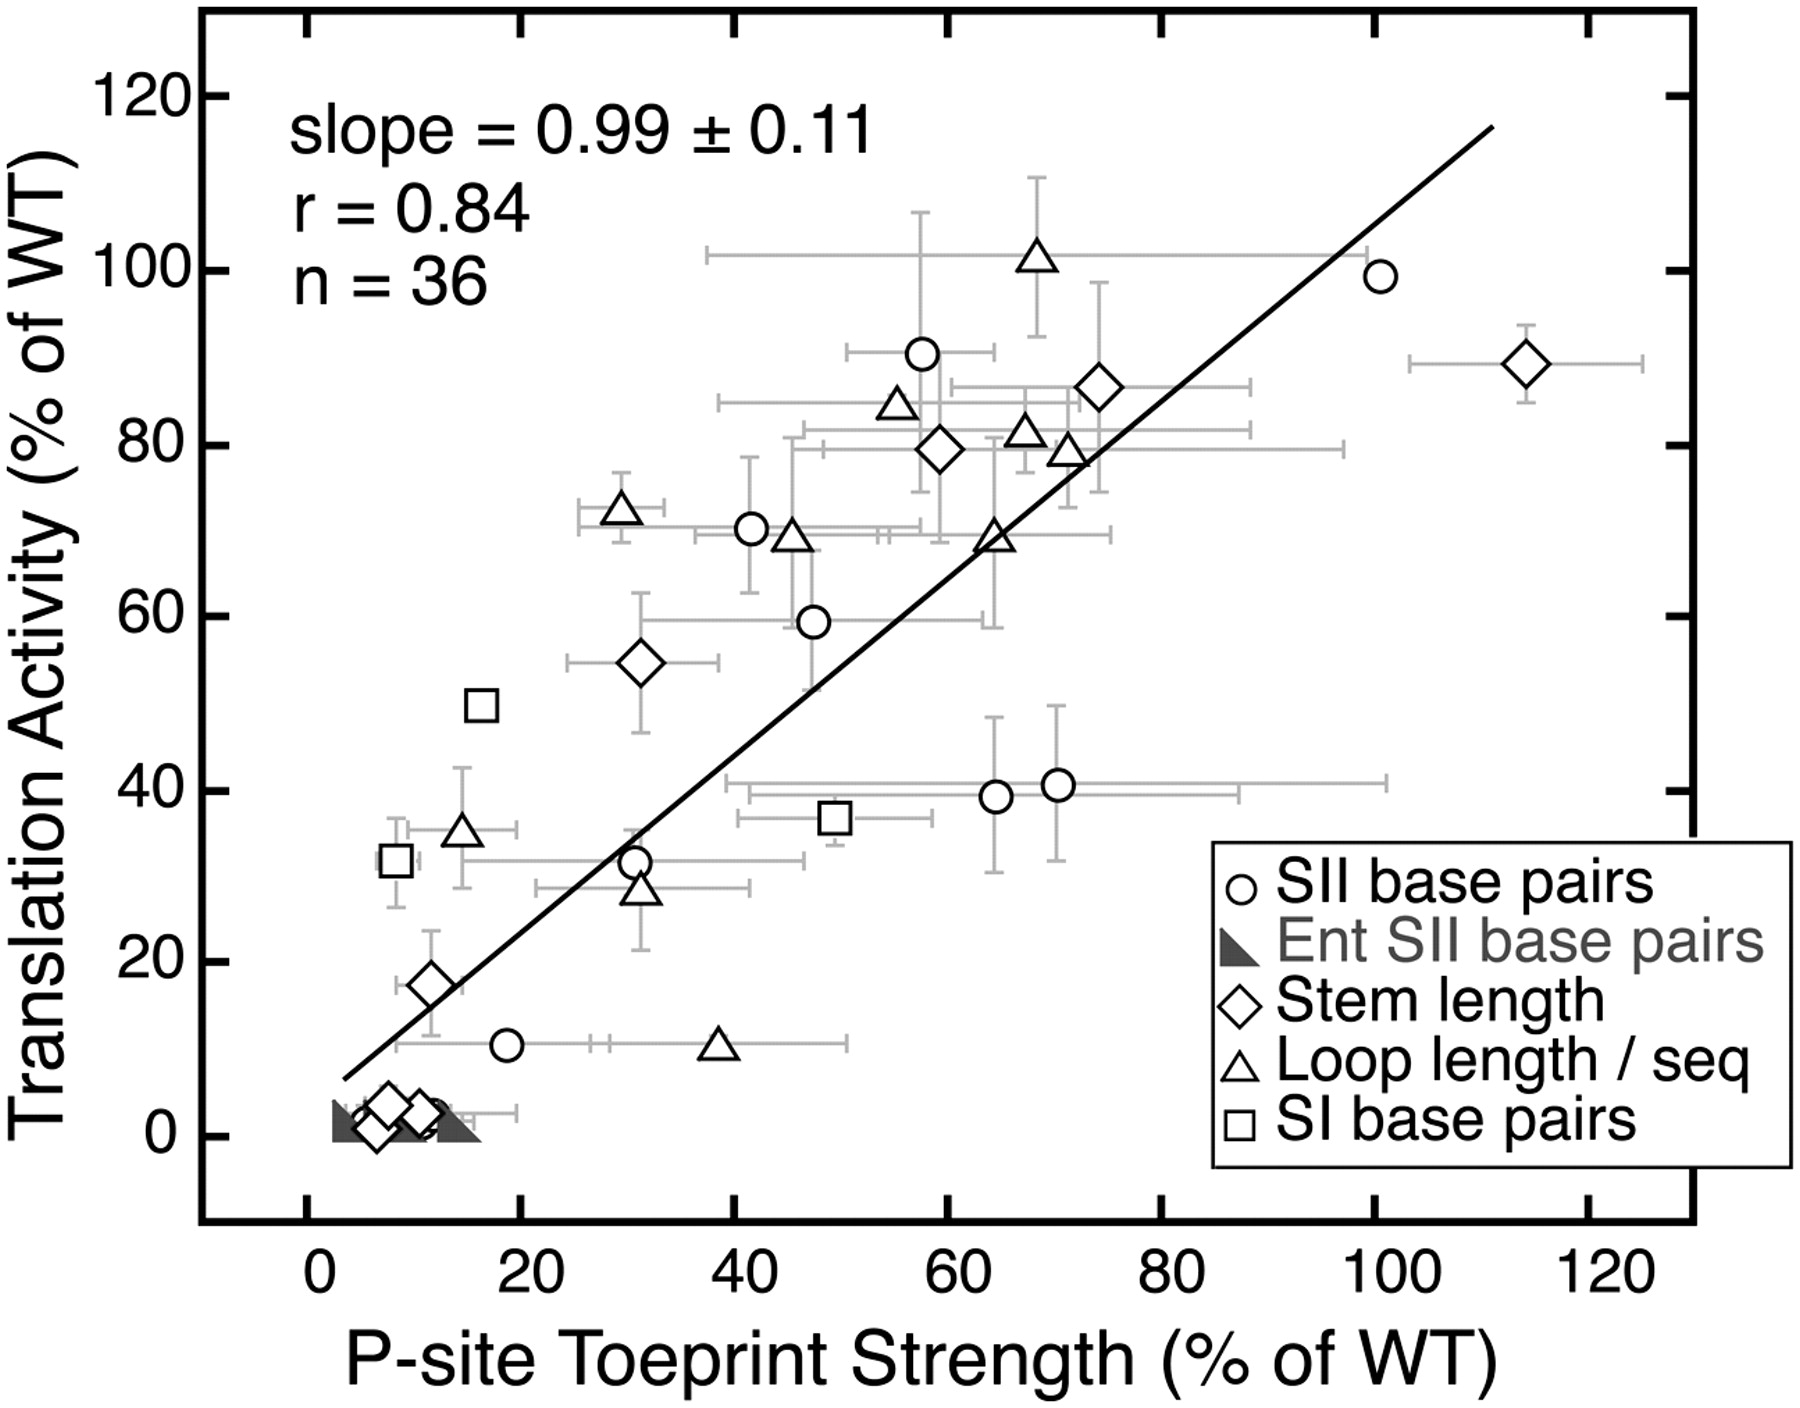
Correlation between toeprint strength and translation activity. Translation activity (as quantified in Table 1) plotted against toeprint stop intensity, quantified by densitometry, and normalized to the toeprint of the WT IRES. Plotted points reflect the mean value of activity across four in vitro translations from two independent transcriptions, and the mean value of the toeprint strength from two independent transcriptions. The error bars around the points extend 1 SD above and below the mean. Mutants are grouped into categories based on what structural features they disrupt, as indicated by the legend, but linear regression was conducted on the full set of 36 mutants together. The estimated slope with a standard error is 0.99 ± 0.11; the correlation is 0.84, which is significantly different from zero at the 0.0001 level.




