


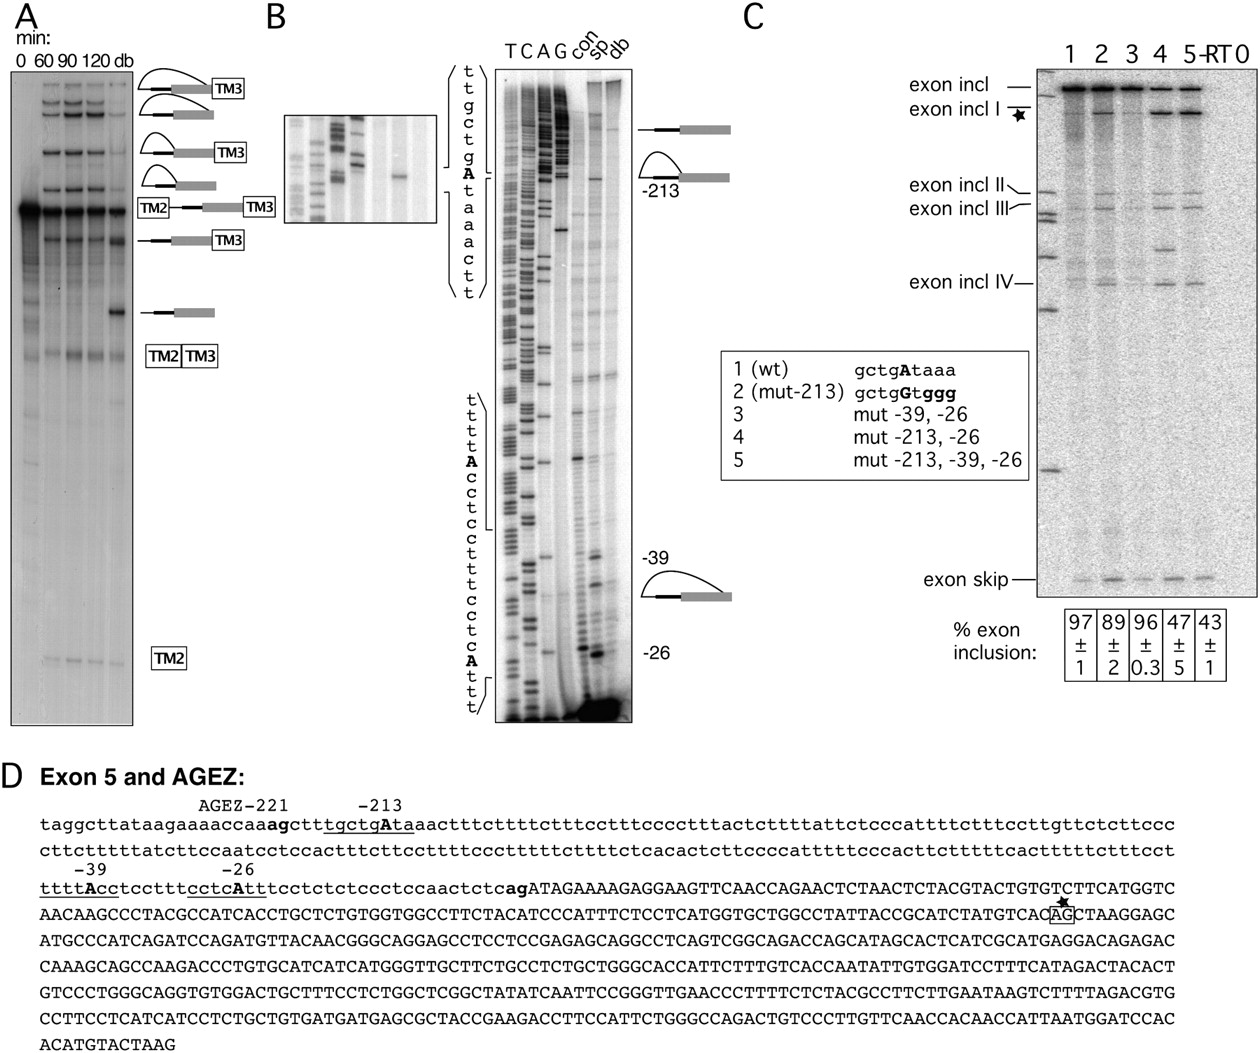
Mapping BPs of exon 5. (A) In vitro splicing of construct containing the HTR4 exon 5 AGEZ. Splicing reactions were incubated from 0 to 120 min. A sample from the 120-min timepoint was subsequently debranched (lane db). Increasing amounts of splicing intermediates and products accumulate over the 120-min time course. Two different populations of lariats and lariat intermediates correspond to differently positioned BPs. (B) Primer extensions map BPs to positions −26, −39, and −213. Left panel shows detail of primer extension and sequencing surrounding the BP; right panel shows primer extension and sequencing with primer hybridizing to the most 3′ end of the intron. Sequences surrounding the BPs are depicted on the left side of the gel. (C) Mutagenesis of BPs in exon trapping construct: lane 1 shows WT splicing pattern with mainly exon inclusion. Upon mutation (lanes 2–5) of As into Gs (sequence changes in bold in box beside the gel) splicing pattern changes to exon skipping and usage of cryptic 3′ ss (exon incl I–IV). Percentage of exon inclusion (n = 3) ± standard deviation is shown underneath the gel. Control lanes are reverse transription reactions without enzyme (−RT) and PCRs without a template (0). (D) Sequence of exon 5 and its AGEZ: intron sequence in lower case and exon sequence in upper case; first upstream AG dinucleotide and 3′ ss AG in bold. Positions of BPs underlined and BP-As in bold upper case. Alternative 3′ ss highlighted in box with star that corresponds to the major alternative 3′ ss product in C that also was validated by sequencing.




