


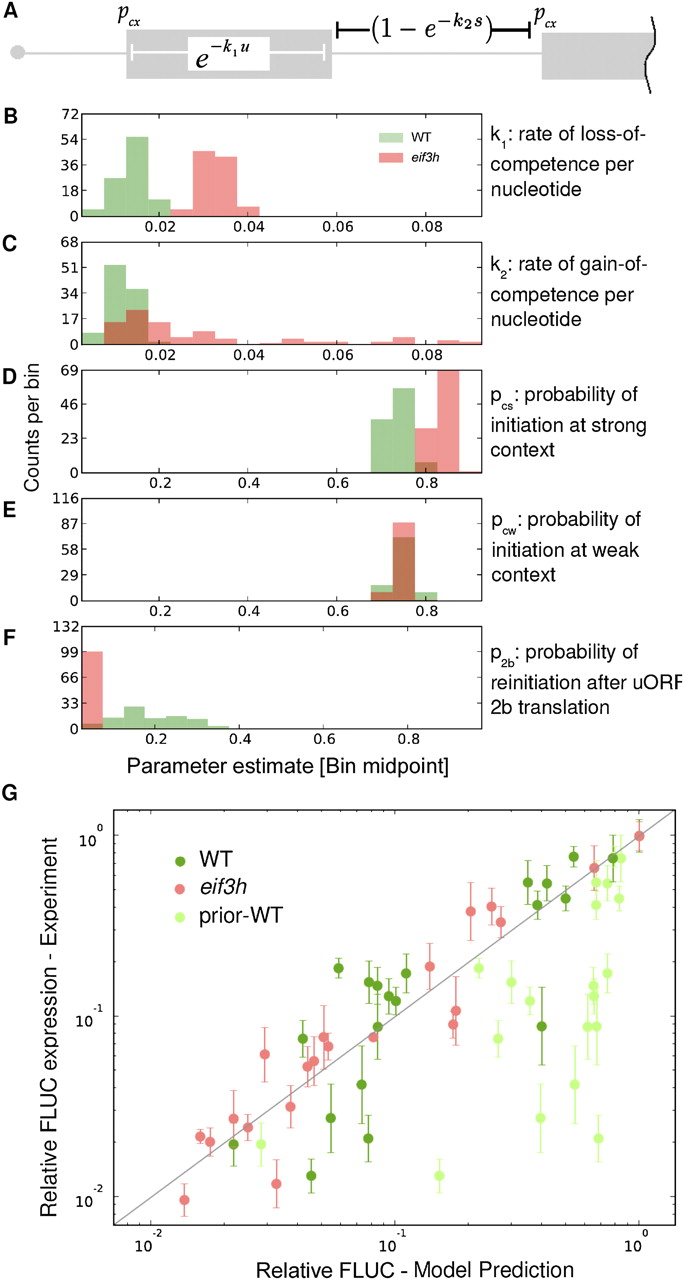
Computer simulation of the translational defect in eif3h mutant plants. (A) Model parameters. (Gray boxes) ORFs. Spanning bars indicate the range over which a given term applies. (B–F) Distributions of parameter estimates. x-axis length reflects the manually set boundaries of possible parameter estimates. y-axis counts indicate the number of times out of 100 trials that a parameter fell into one of 20 x-axis bins. (B) Loss rate of reinitiation competence (k1) as a function of uORF length (u [nt]). (C) Regaining of reinitiation competence (k2) as a function of intercistronic spacer length (s [nt]). (D) Probability of AUG recognition in a strong context (pcs). (E) AUG recognition in a weak context (pcw). (F) Escape from attenuation upon translation of uORF2b peptide (p2b). (G) Scatter plot illustrating the match between model output using MLEs (x-axis) and experimental data (y-axis, ± one standard error) for all 21 AtbZip11 5′ leader constructs in wild-type (dark green) and eif3h plants (red). (Light green symbols) Predicted expression values using model parameters culled from the literature (see Table 1).




