


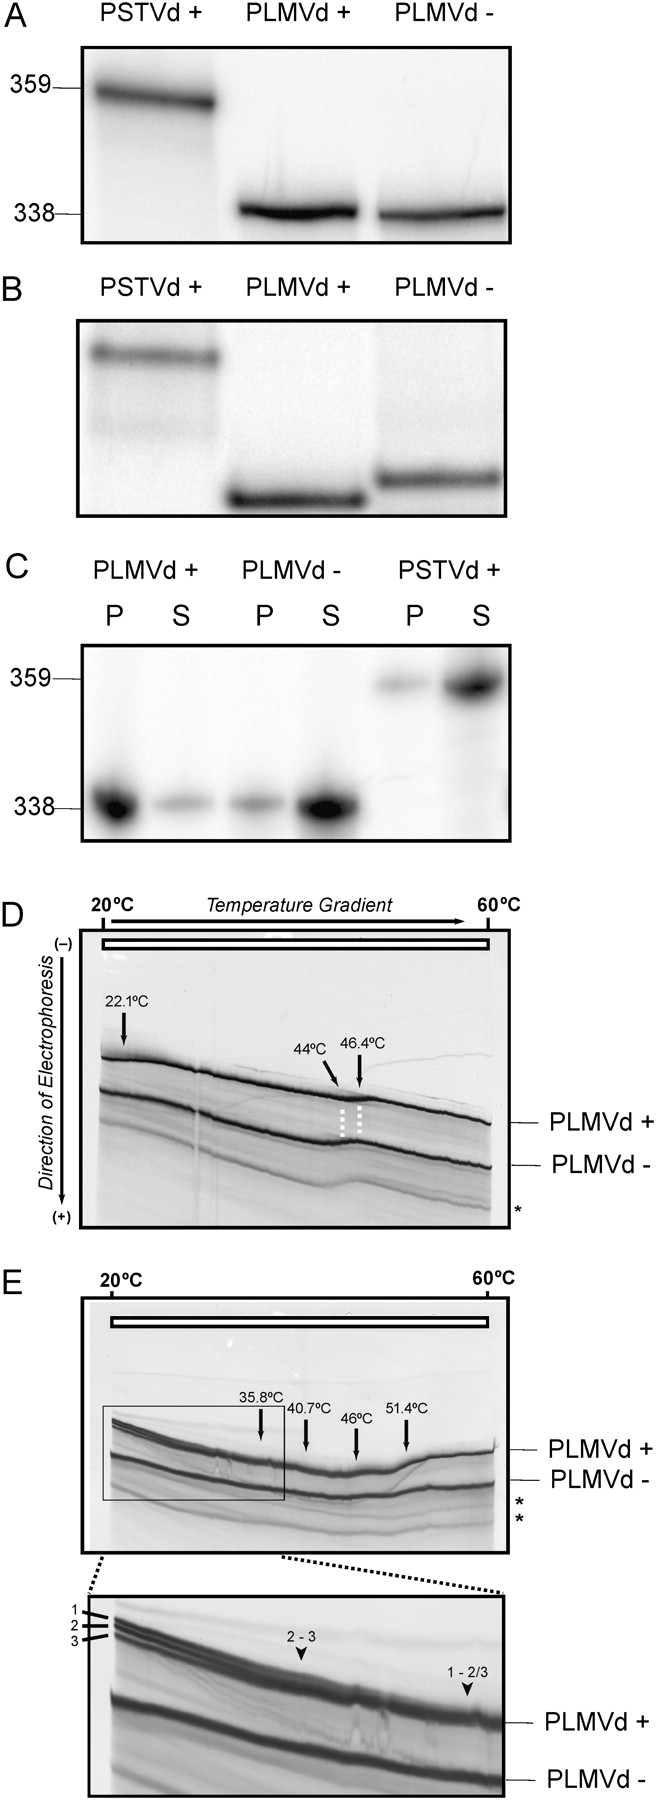
Biophysical characterization of the PLMVd transcripts of both polarities. (A,B) Autoradiograms of 5% PAGE gels run under denaturing (A) and native (B) conditions. PSTVd transcripts were used as molecular weight markers. The lengths, in nucleotides, of the transcripts are indicated on the right. (C) Autoradiogram of a denaturing 5% PAGE gel performed in conjunction with the lithium chloride precipitation experiment. S and P represent the supernatant and the pellet fractions, respectively. (D) TGGE analysis performed in 0.2× TBE buffer. Plus strand was applied 30 min later than the minus strand. The important transition temperatures are indicated by the arrows. (E) TGGE analysis of PLMVd transcripts performed in 0.2 × TB buffer containing 10 μM magnesium acetate. Plus strand was applied 30 min later than the minus strand. The sequential transitions are indicated by the arrows. The thin-lined box located at the bottom of the gel illustrates an area enlarged for better detail. The numbers on the left identify the three coexisting structures present at the lower temperature for plus polarity PLMVd transcripts. The arrowheads with the corresponding numbers designate where the transition curves of these coexisting structures merge due to conformational changes of the RNAs into a common intermediate. The asterisks represent the circular form of both polarities.




