


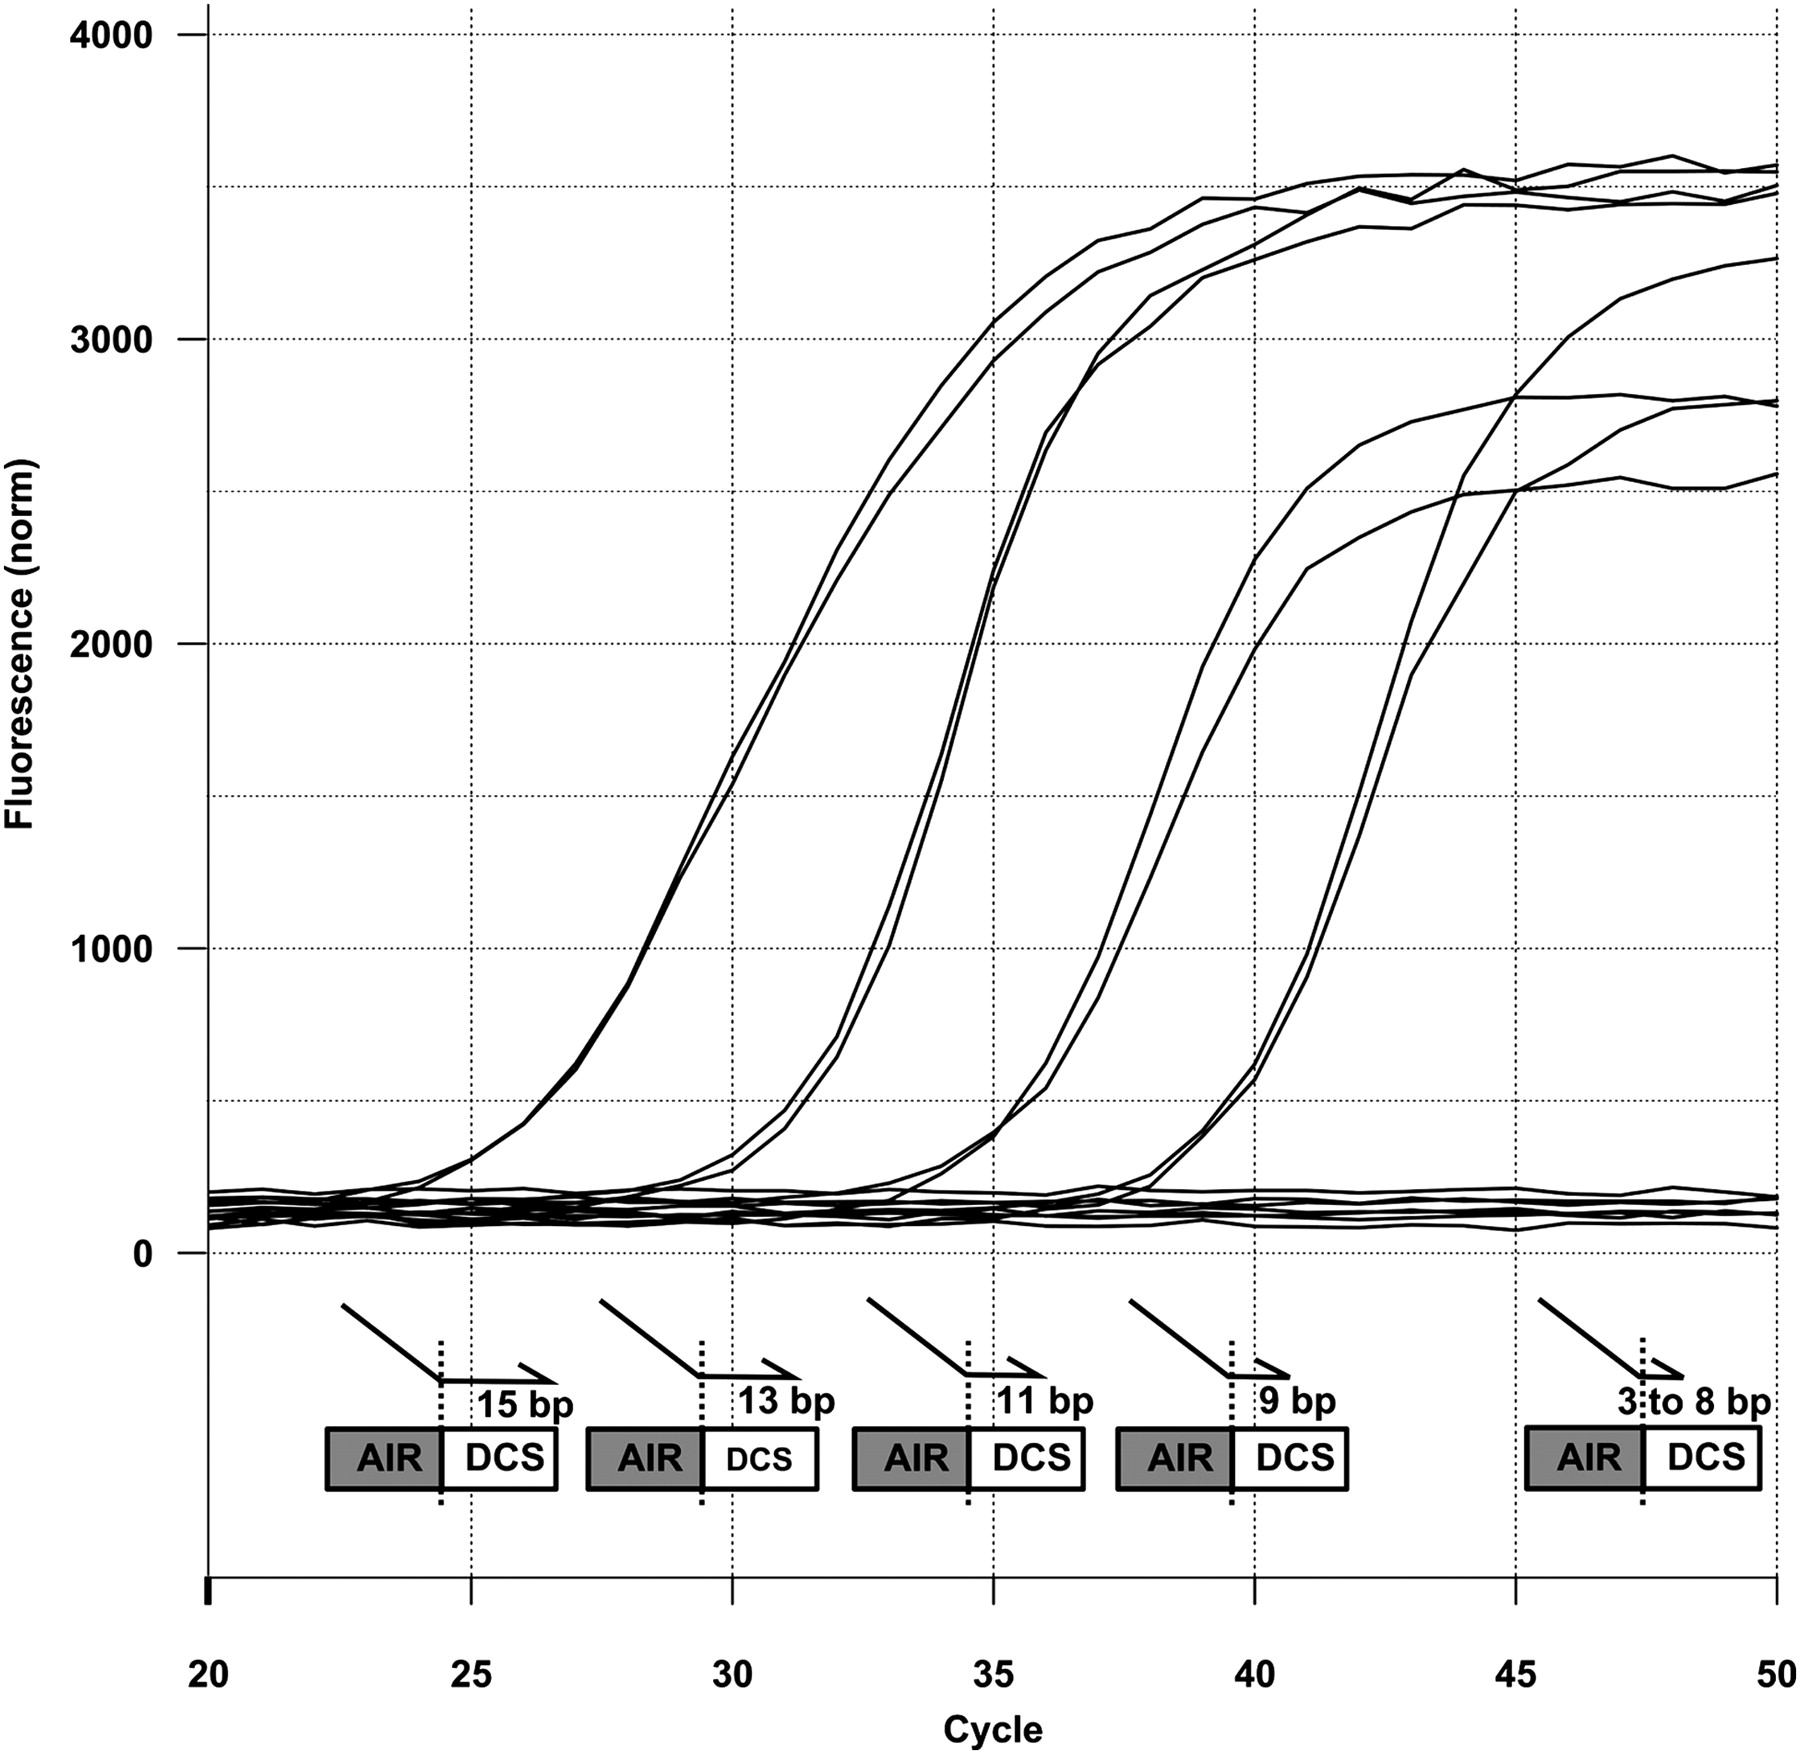
FIGURE 2.
Systematic tiling of BSPs across an exon–exon junction. BSPs harboring 15, 13, 11, and 9 bp complementarities to BCAS1 long splicing isoform in their 3′ end show amplification curves, while those with 8, 7, 5, and 3 bp or no template controls show no amplification. AIR and DCS stand for alternatively included region and downstream constitutive sequence, respectively.




