


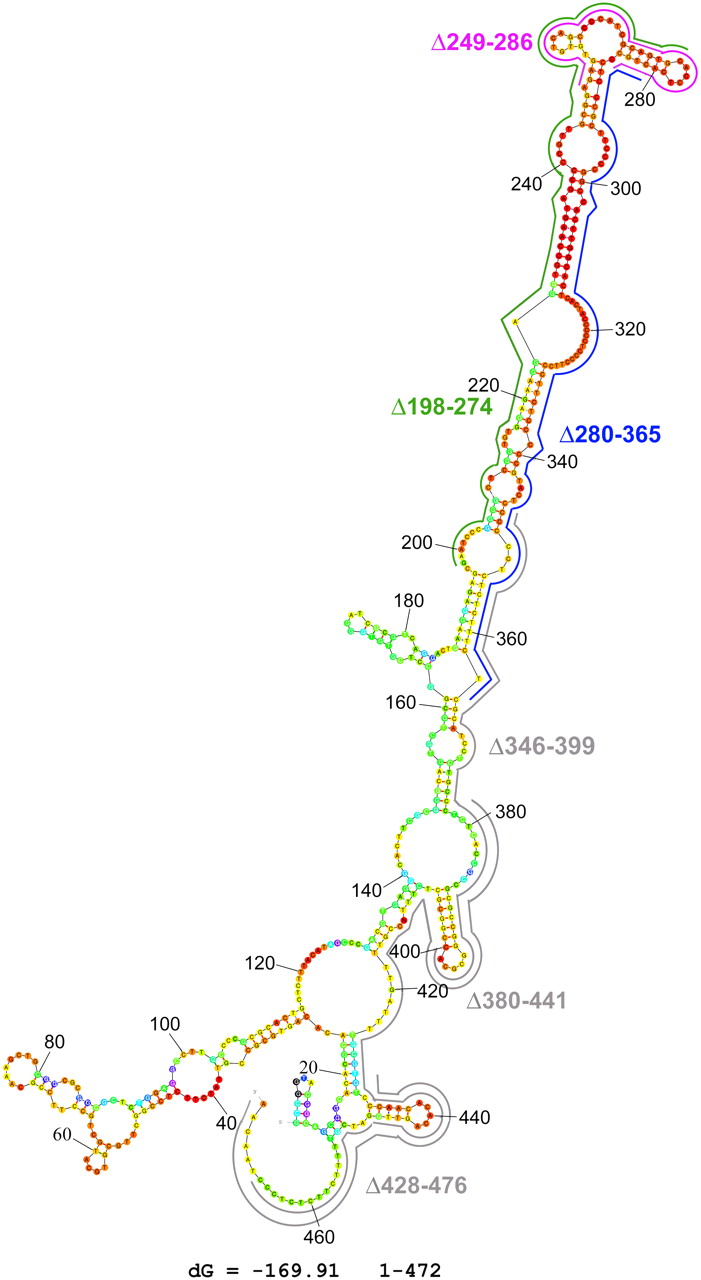
Structure prediction of the Hsp83 3′ UTR element 1–472 by UNAfold. Color annotation was used to indicate the propensity of individual nucleotides to participate in base-pairing and whether or not a predicted base pair is well determined. Forty colors that range from red (unusually well determined) through orange, yellow, green, blue, purple to black (poorly determined) are used (Zuker and Jacobson 1998). The structure with the lowest ΔG that was obtained using the Mfold program is shown, and the color of each nucleotide indicates its estimated P-value. The deletions which are described in Figure 1 are positioned on the predicted structure. Deletions that abolished preferential translation are colored in green (Δ198–274), purple (Δ249–286), and blue (Δ280–365). Deletions that did not affect preferential translation are marked in gray (Δ346–399, Δ380–441, and Δ428–476).




