


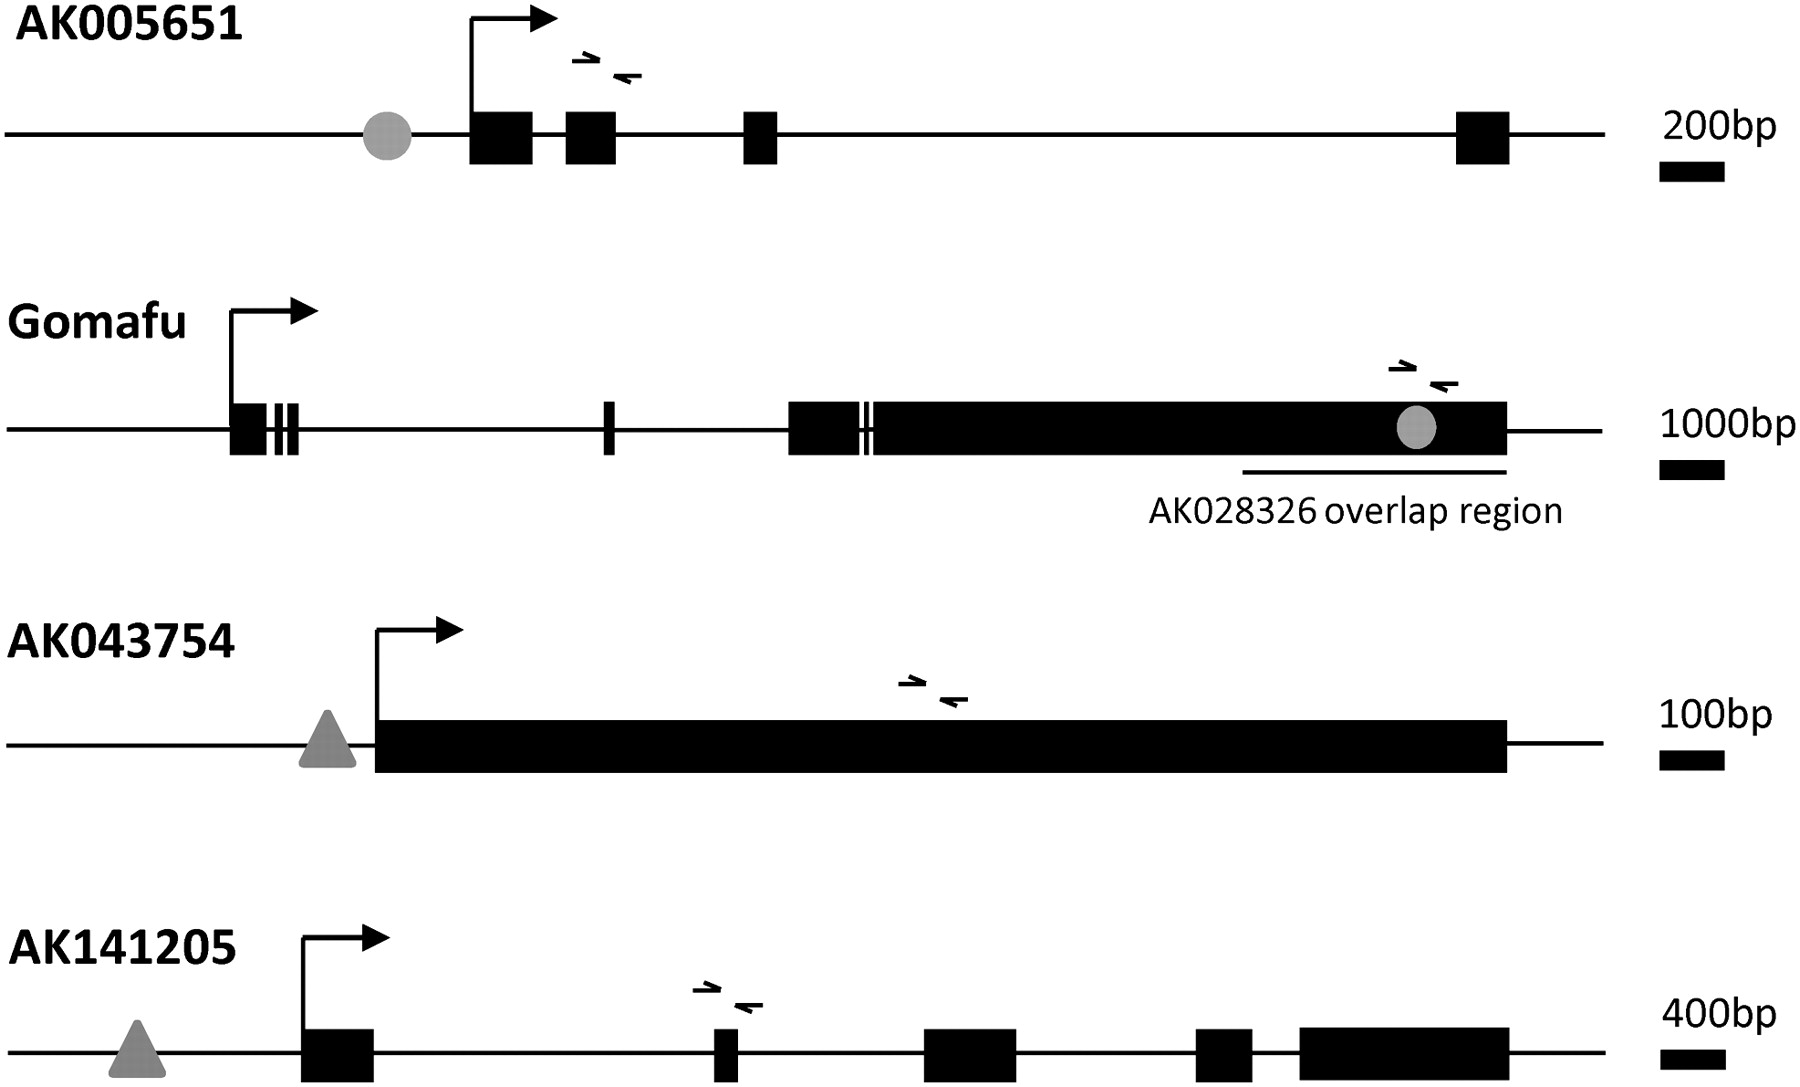
FIGURE 1.
Graphical representation of the lncRNA genomic loci and approximate sites of transcription factor interaction. (Black boxes) Exonic sequences, commencing at the transcriptional start site (right-angle arrow); (gray ovals) putative Oct4 binding sites supported by Oct4 ChIP-PET data; (gray triangles) putative Nanog binding sites supported by Nanog ChIP-PET data; (small arrowheads) forward and reverse primer binding sites for real-time PCR primers. Gene length is indicated by the scale bar provided.




