


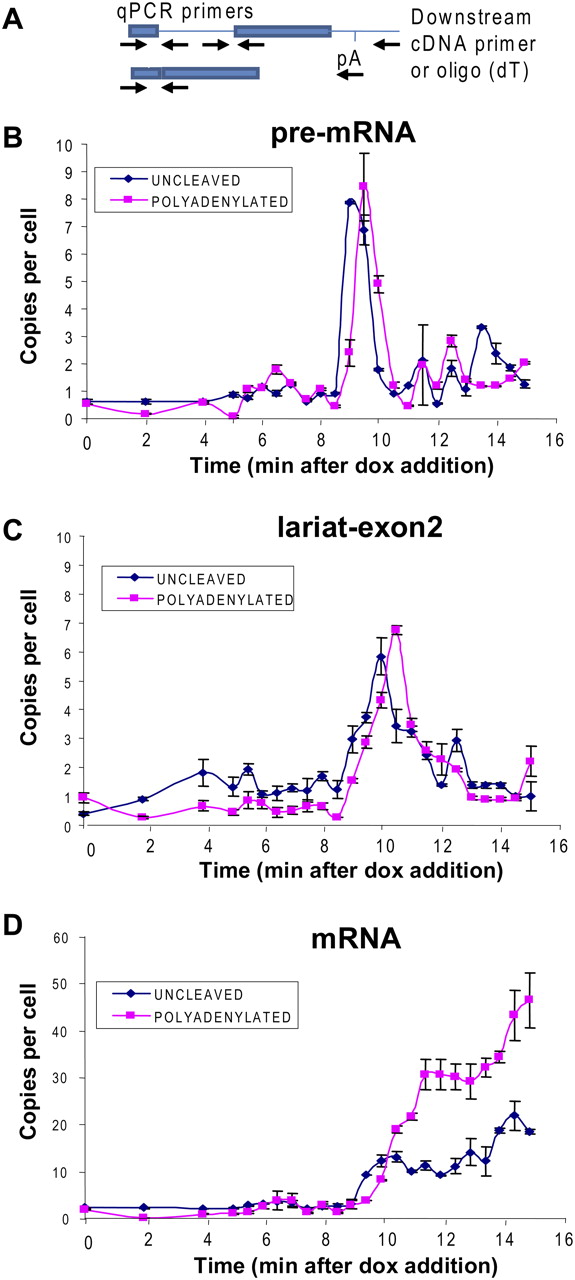
Kinetic analysis of splicing and 3′-end formation of Ribo1 transcripts demonstrates cotranscriptional splicing. RNA, sampled at 30-sec intervals during a time course of induction of Ribo1, was reverse transcribed with either oligo (dT) to copy cleaved and polyadenylated transcripts, or with a primer downstream of the mapped cleavage/poly(A) sites to copy uncleaved transcripts (there is a short delay between transcription through the poly(A) site and 3′-end cleavage). qPCR was performed to measure unspliced and spliced transcripts. (A) Schematic of the assay, showing the approximate positions of primers used for qPCR of unspliced pre-mRNA (across 5′SS), lariat intron-exon (across 3′SS then subtract the value for pre-mRNA) and spliced mRNA (across exon junction) or used to prime cDNA synthesis. pA indicates the 3′-end cleavage/polyadnylation site. Results are shown for: pre-mRNA (B), lariat intron-exon2 (C), and mRNA (D). As a control, it was demonstrated that no cDNA was produced when oligo (dT)-selected polyadenylated RNA was reverse transcribed using the downstream primer (data not shown).




