


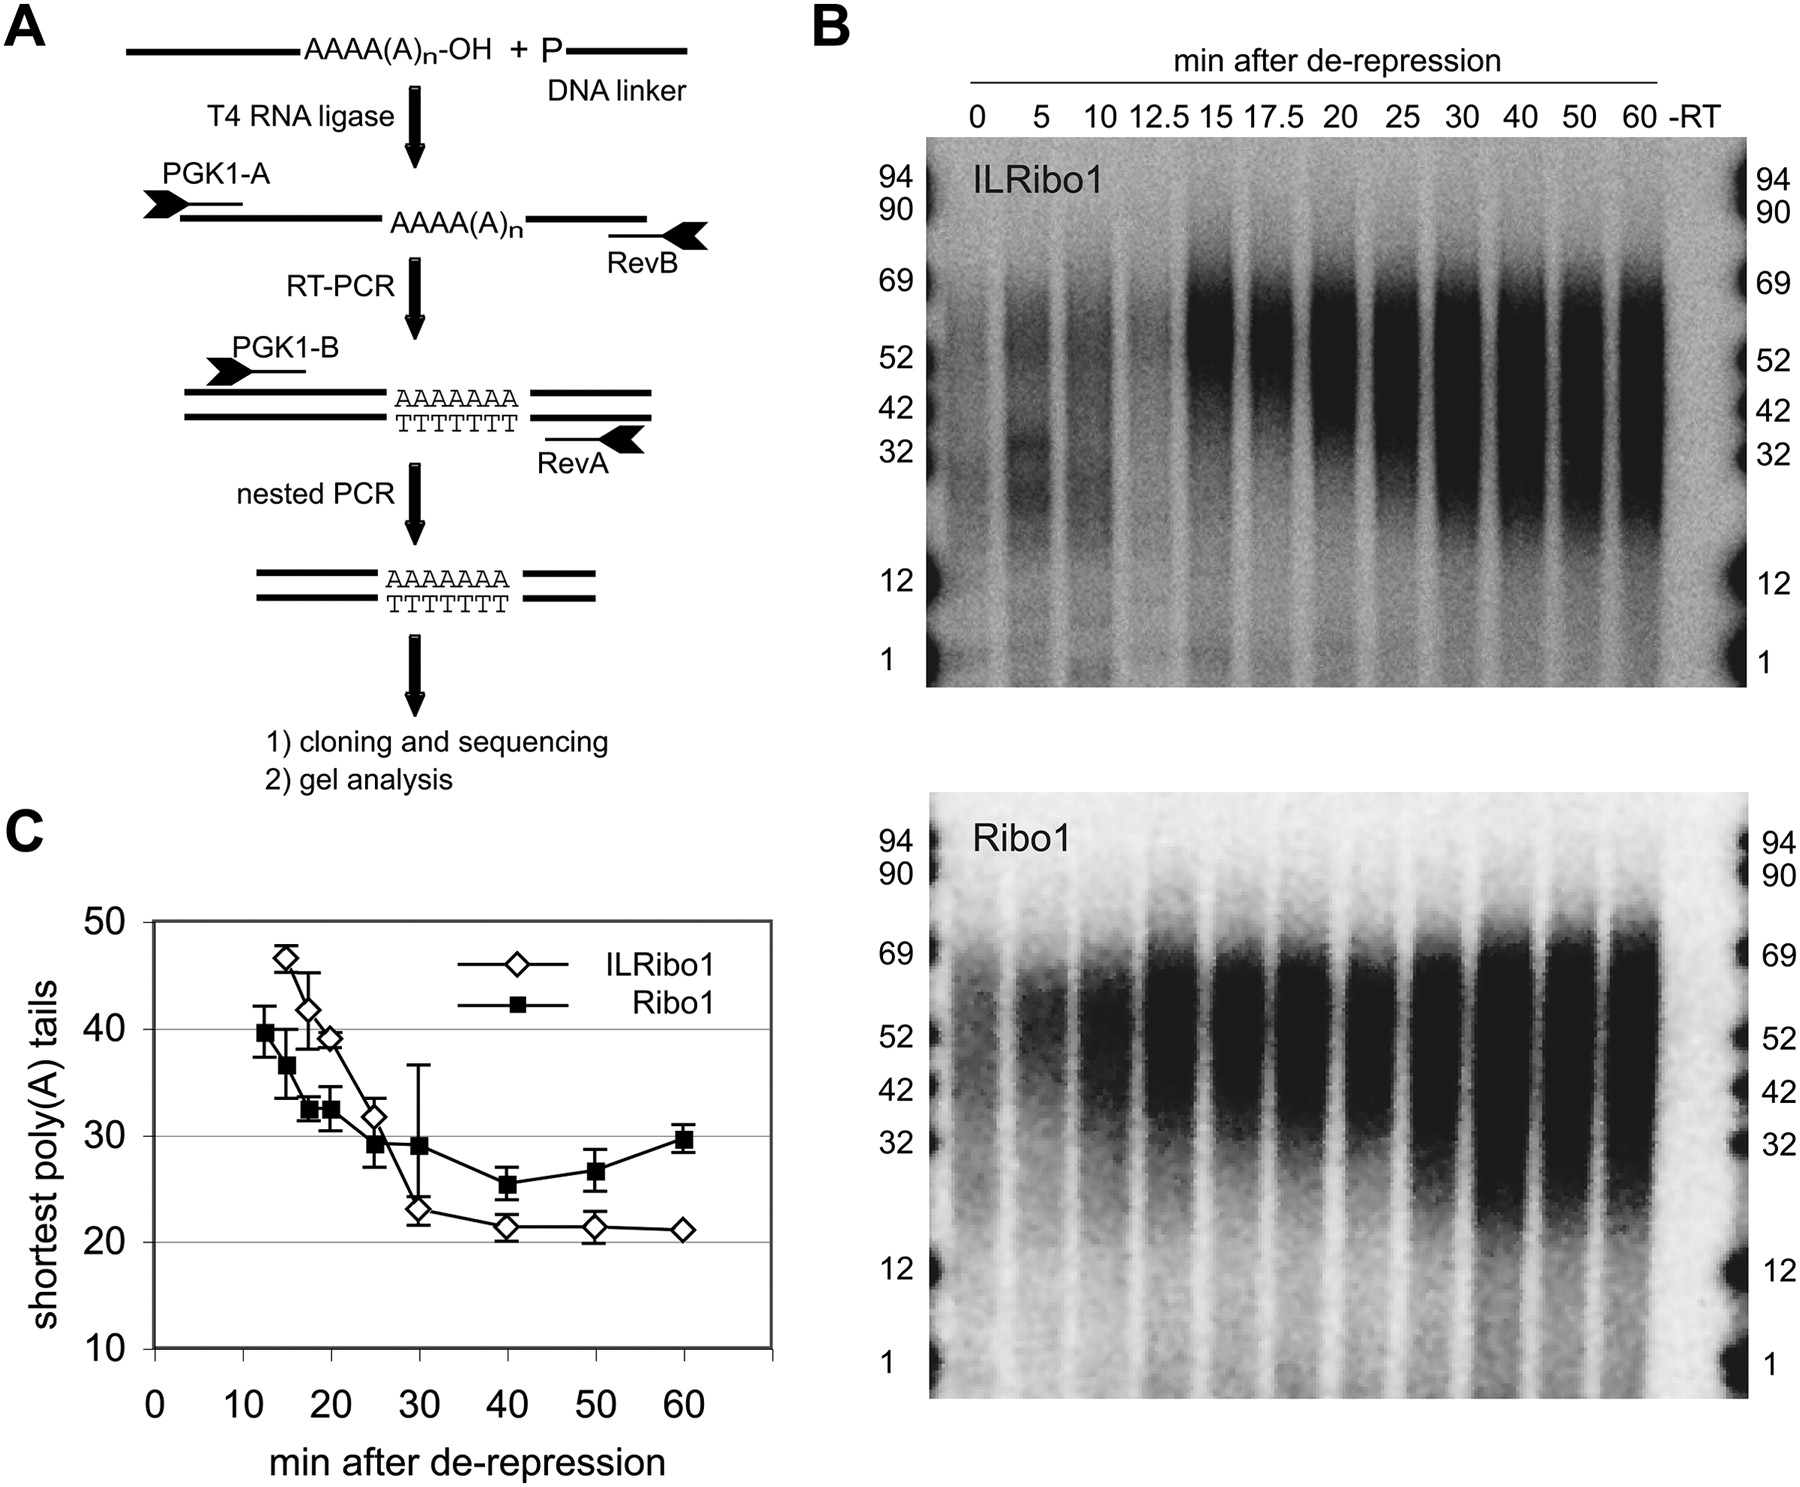
3′-End formation and deadenylation (A) Flow diagram of the PCR-based method that was applied to analyze transcript 3′-end formation. In a first step a 5′ phosphorylated DNA linker oligonucleotide is ligated by T4 RNA ligase to available 3′-OH groups. This is followed by first-strand cDNA synthesis using the linker-specific RevB oligonucleotide and subsequent PCR analysis. The obtained PCR product is further amplified by nested PCR using RevA and PGK1-B oligonucleotides. The obtained PCR product can be transferred into a plasmid and analyzed by DNA sequencing. Alternatively, the nested PCR can be performed with radioactively labeled oligonucleotides and PCR products can be separated on denaturing polyacrylamide gels. (B) Time course of adenylation/deadenylation following derepression of ILRibo1 and Ribo1 in the tetOFF strain, analyzed as described in A. Radioactive PCR products were resolved on 6% (w/v) polyacrylamide/ 8.3 M urea gels. The length of the poly(A) tract associated with the PCR products is indicated by numbers. To control for specificity of PCR amplification a minus reverse transcriptase (−RT) control was included. (C) Graph depicting the length of the shortest poly(A) tails observed at individual time points during reporter derepression. Data are the mean of three (− Intron) and four (+ Intron) experiments and error bars represent S.D. Deadenylation rates were derived from initial linear phases of poly(A) shortening.




