


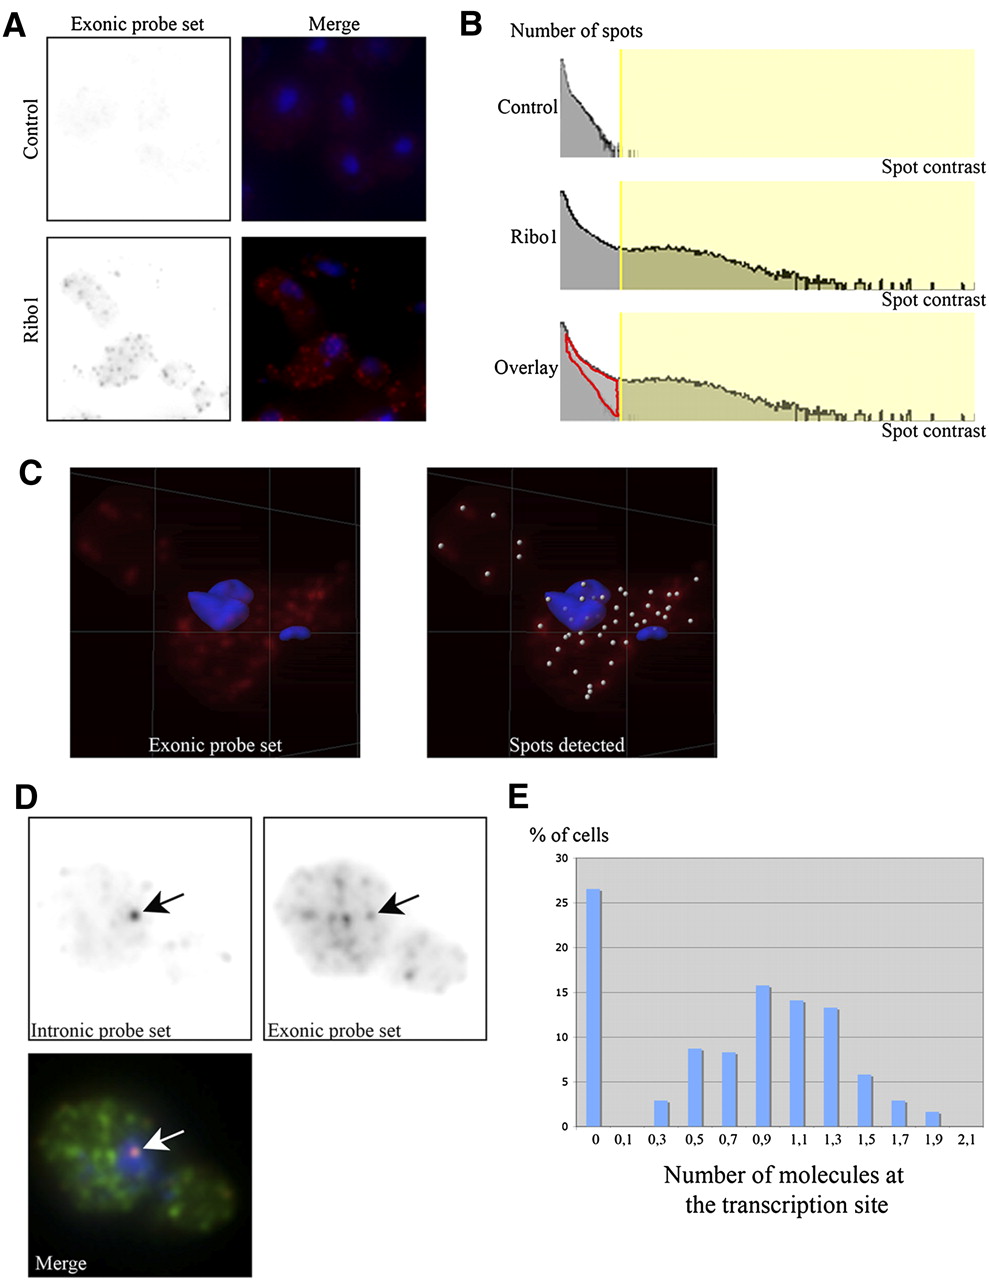
Image based measurement of Ribo1 RNAs in individual yeast cells. (A) Detection of single molecules of the Ribo1 reporter RNA in TetOFF strains. Control strain lacking the reporter gene (top), or expressing Ribo1 (bottom) were hybridized in situ with the exonic probe set. Right panels display maximal image projections of the RNA signal (red) overlayed with the nuclei (blue). Each field is a projection of a 3D stack (6 × 6 × 6 μm). (B) Efficiency of RNA detection. Histograms of the number of spots versus spot contrast across an entire 3D stack (63 × 63 × 6 μm) are shown for control and Ribo1 expressing cells. The area shaded in yellow corresponds to the spots included in the analysis after thresholding. Bottom panel: overlay of the two histograms revealing the amount of Ribo1 mRNA molecules lost by the thresholding procedure (red area; <20% of the total number of spots identified) (C) Maximal image projection (3.5 × 3.5 × 6 μm) of a cell with the spots identified indicated with small spheres on the right panel. (D) Single plane of a Ribo1 expressing cell with both the exonic (Cy5, green) and the intronic signals (Cy3, red). Blue: Dapi. Each field is 3.6 × 3.6 μm. Arrows indicate the position of the intronic focus that identifies the putative transcription site. (E) Histogram plotting the number of molecules of Ribo1 RNA, identified with the exonic probe set, at the intronic foci (putative transcription site). Cells with zero molecules have no signal for the intronic pool of probe.




