


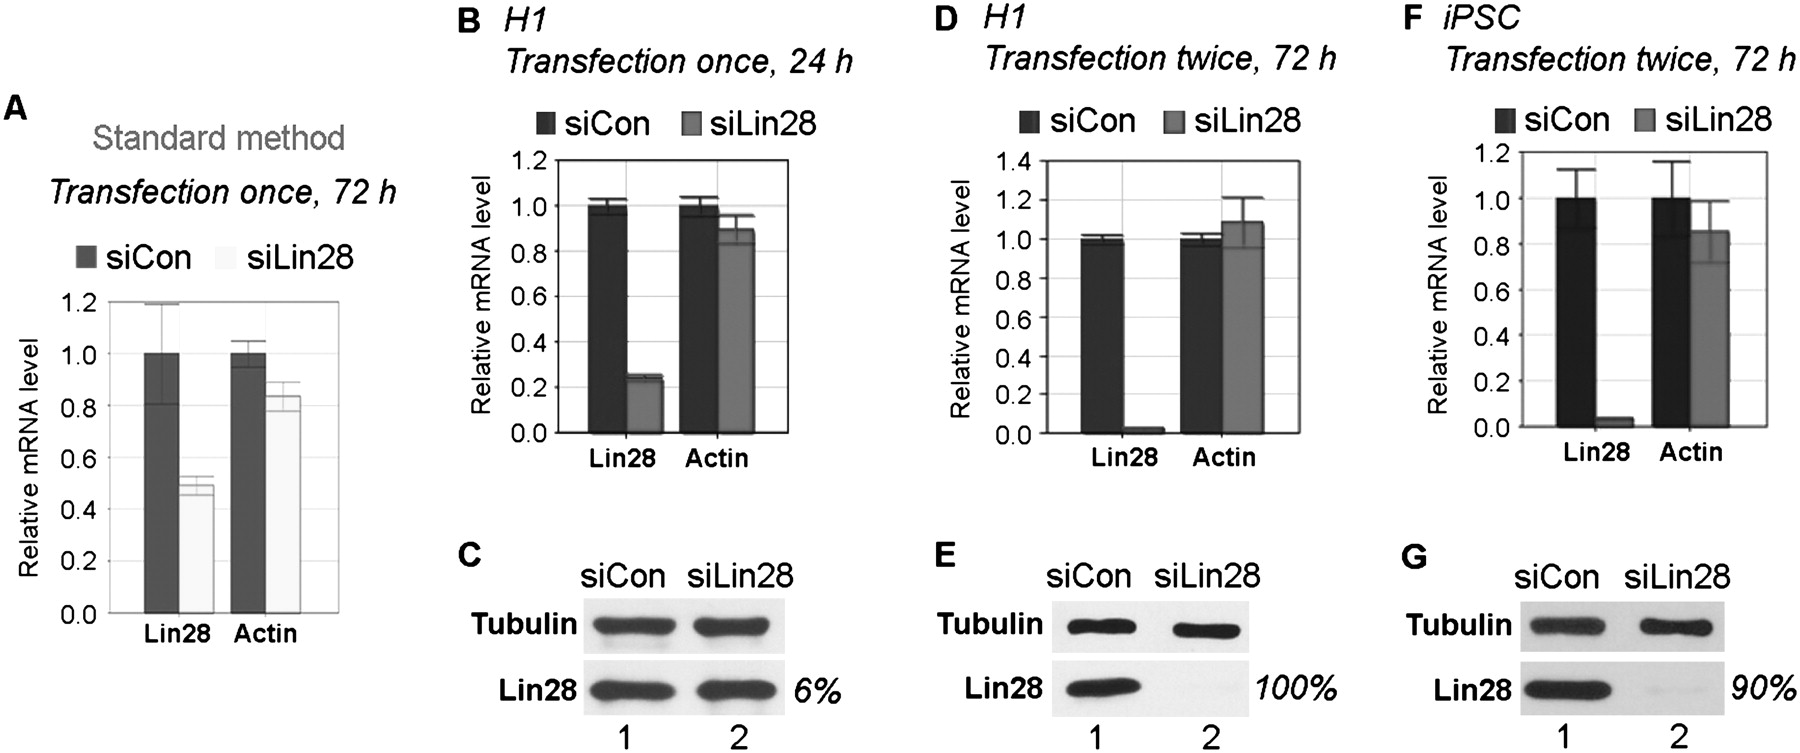
siRNA knockdown of Lin28 in H1 (A–E) and iPSC (F,G) cells, using standard (A) or new (B–G) method. (A,B,D,F) Results of qRT-PCR. Relative mRNA levels are shown after normalization against β-tubulin mRNA. mRNA levels in cells transfected with siCon were arbitrarily set as 1. Numbers are mean ±SD (n = 3). (C,E,G) Representative Western blot results. Antibodies used are shown on the left. Protein bands on Western blots were determined using Bio-Rad Quantity One software, and calculated after normalization against β-tubulin loading control. Lin28 protein levels in cells transfected with siCon were arbitrarily set as 100%. Percentages at right indicate knockdown efficiencies.




