


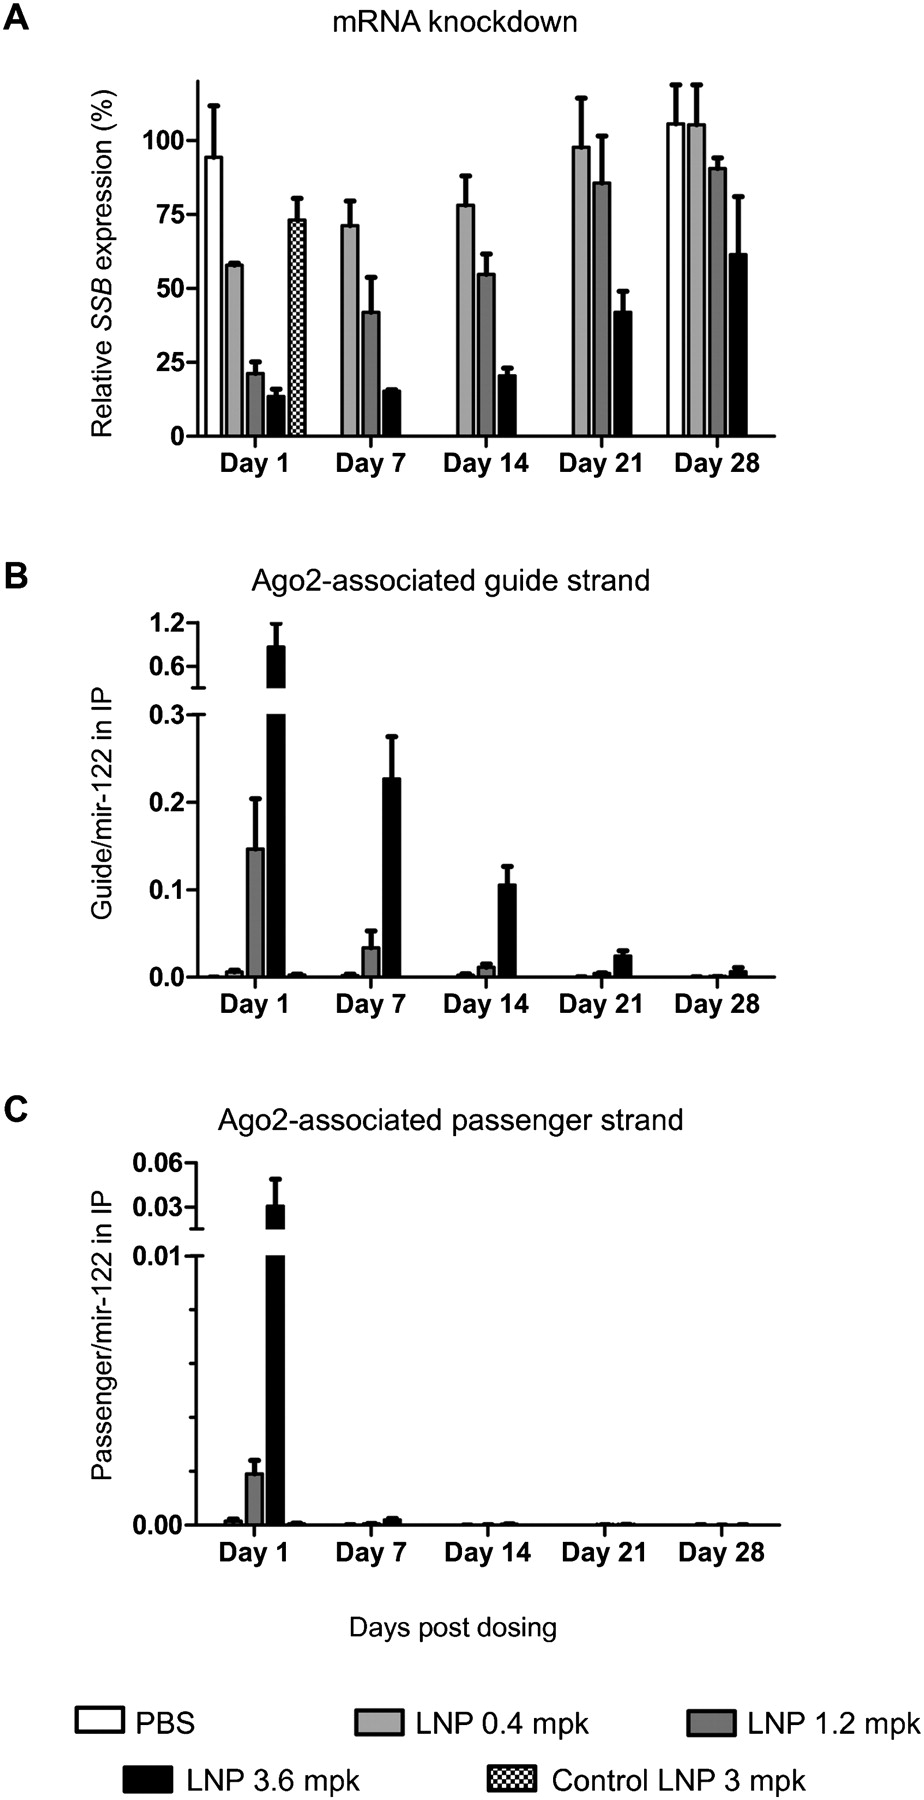
FIGURE 3.
Target (Ssb) gene silencing and quantification of Ago2-associated siRNA strands in mouse liver samples. (A) Dose-response and duration of knockdown in liver after a single intravenous administration of PBS or indicated LNP-siRNA. Expression levels of Ssb relative to housekeeping Ppib were determined by quantitative RT-PCR and expressed as percentage values in relation to PBS-treated animals. (B,C) Levels of Ago2-associated siRNA guide strand (B) or passenger strand (C) after normalizing their copy numbers to those of coimmunoprecipitated mir-122. The non-normalized copy numbers of the small RNAs are plotted in Supplemental Figure 5. Each bar, group mean ± SD (n = 4 per group).




