


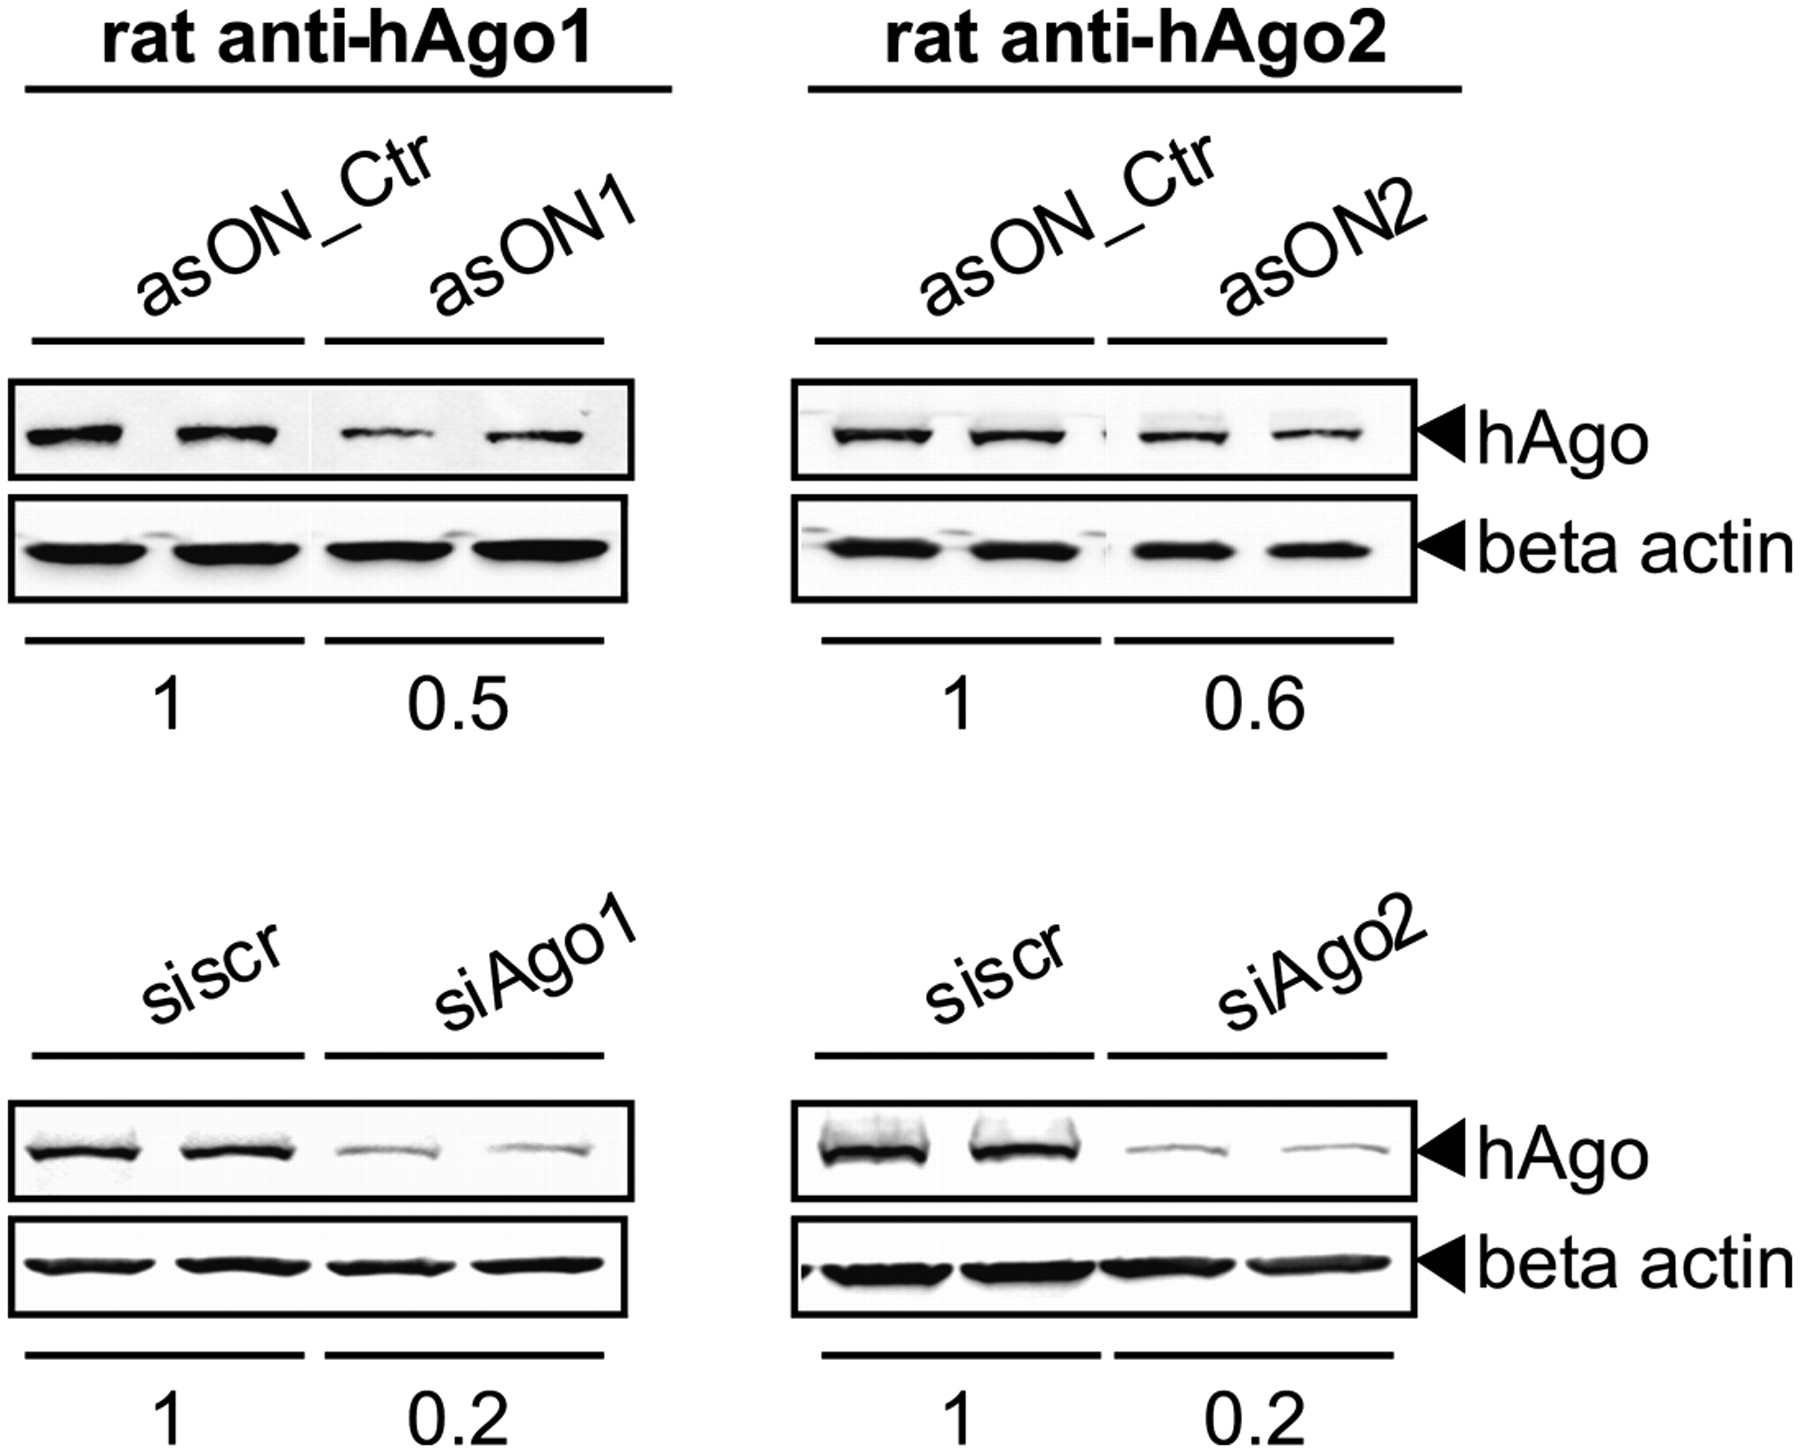
Down-regulation of hAgos at the protein level by specific asONs or siAgos. ECV304 cells were transfected with 100 nM asON or siAgo (specific for hAgo1, [left] or for hAgo2, [right]). As controls, 100 nM asON_Ctr or siscr were used. After 48 h, the cells were collected, lysed, and a Western blot analysis was performed using rat-anti human Ago1 and Ago2 antibodies. The hAgo proteins were seen as bands with a molecular weight of ∼100 kDa. As loading control, β actin was detected, which is shown at the bottom. The ratio between hAgo protein and β actin was normalized to asON_Ctr or siscr, and the resulting values are indicated at the bottom of the blots.




