


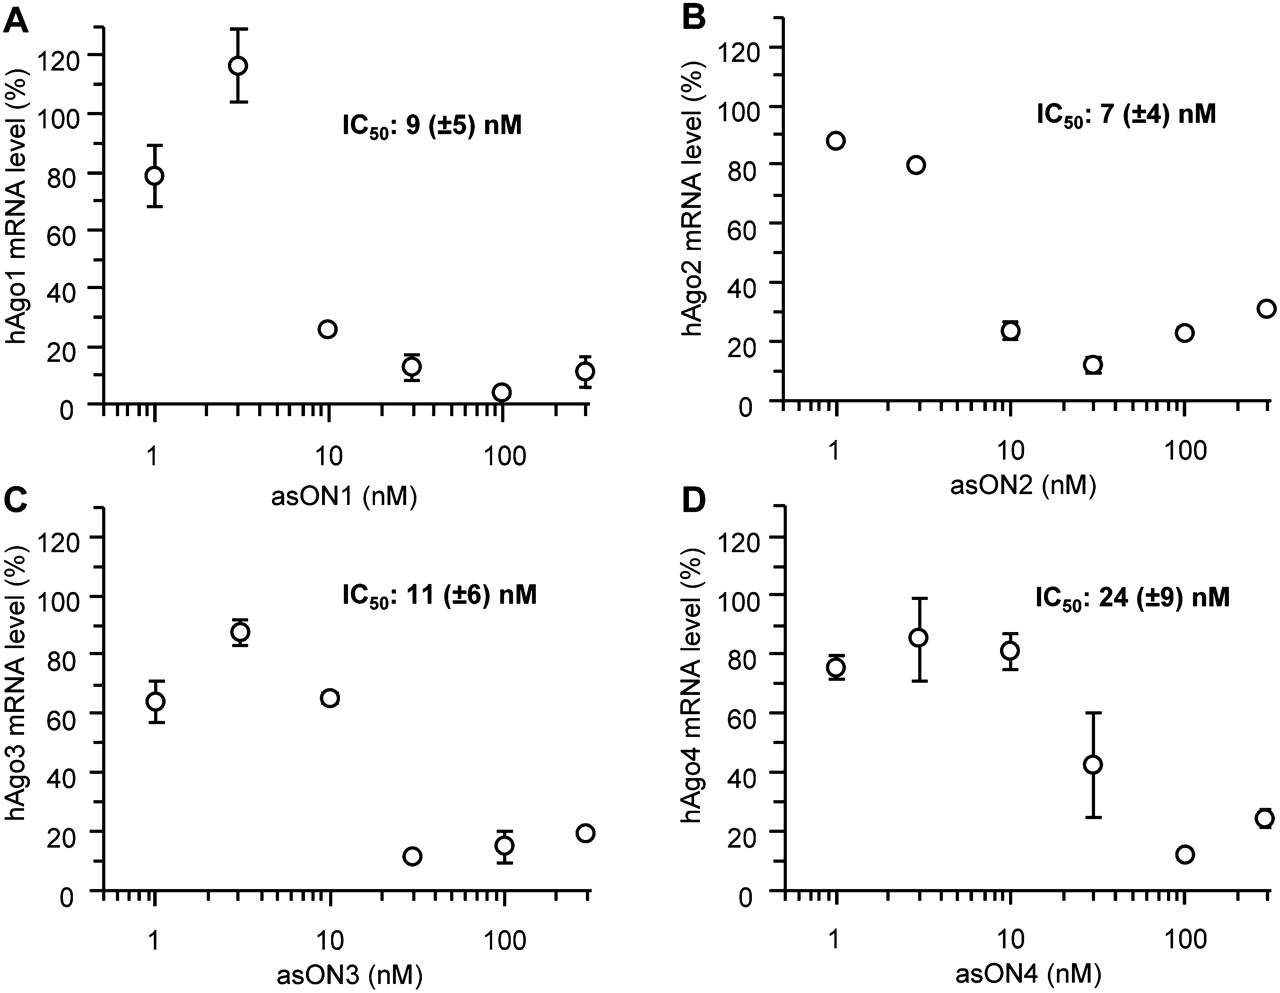
The selected asONs show a strong inhibitory effect on hAgo mRNA expression. Dose-response curves of asON1, which is specific for hAgo1 mRNA (A), asON2, which is directed against hAgo2 mRNA (B), asON3, which was designed for hAgo3 mRNA (C), and asON4, which was selected for hAgo4 mRNA (D). The IC50 determination was performed transfecting ECV304 cells with increasing amounts of asON (0–300 nM). Cells were collected 24 h after transfection and the total RNA was isolated and reverse transcribed. The cDNA was quantified by RT–qPCR and a housekeeping gene, β glucuronidase, was used as internal control. Indicated are the hAgo mRNA levels and the IC50 values, which were calculated by using GraFit5 program. As an additional control, cells were transfected with an asON (asON_Ctr) that has no endogenous target, and the hAgo mRNA level was set at 100%. Indicated are mean values and standard deviations.




