


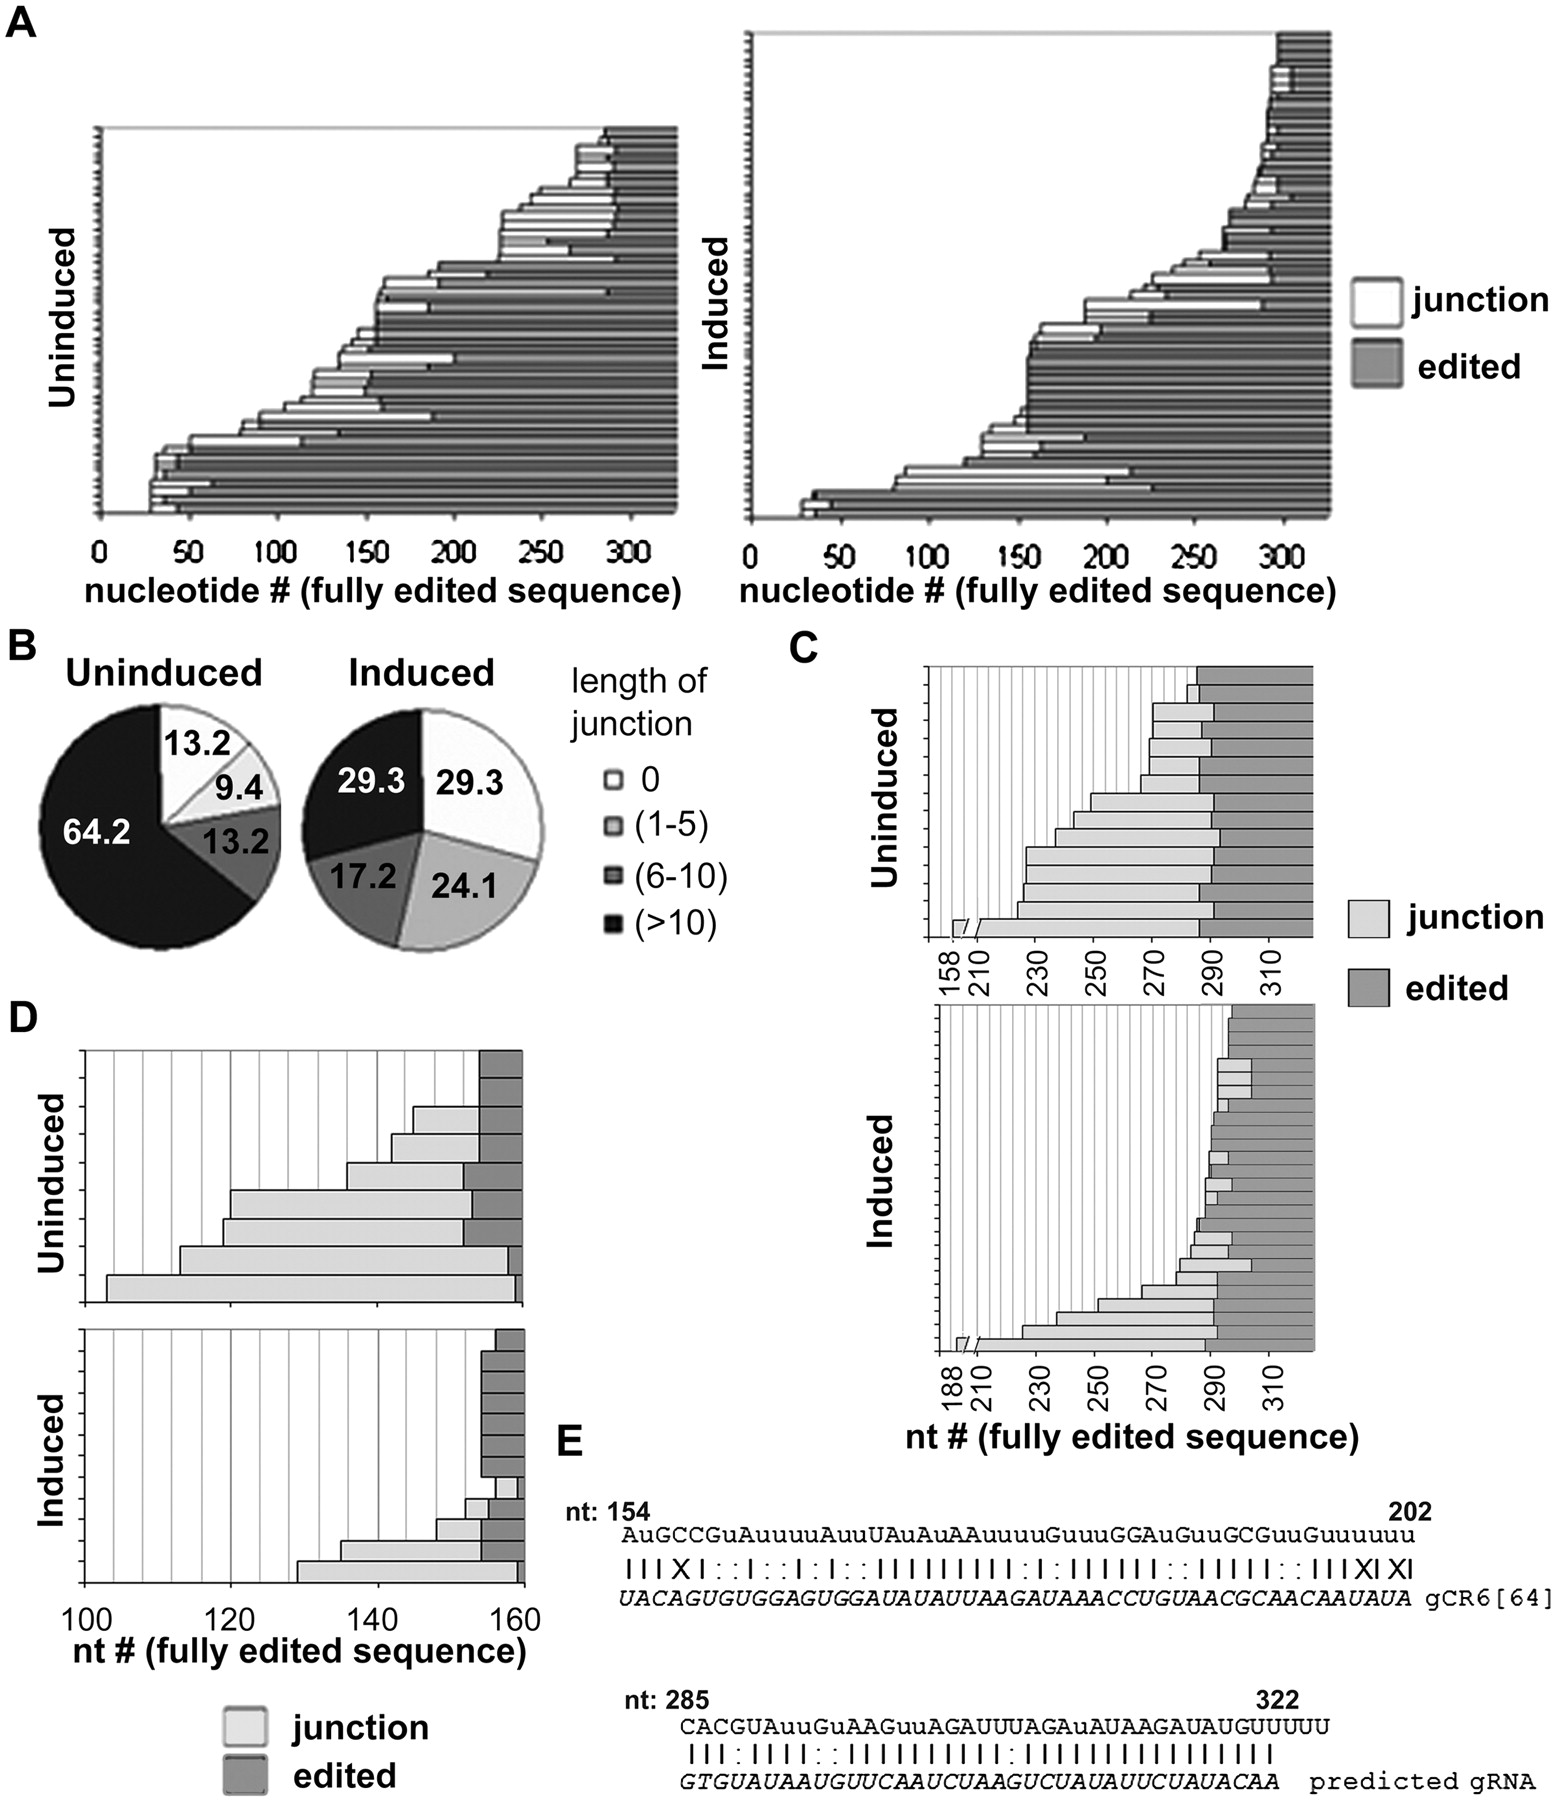
Depletion of TbRGG2 results in shorter junction regions in RPS12 RNAs. (A) Graphic representation of RPS12 cDNAs cloned and sequenced from RT-PCR reactions shown in Figure 4. Dark gray represents fully edited sequence, and light gray represents junction region. The nucleotide number of the fully edited sequence is shown on the bottom. cDNAs isolated from uninduced cells are shown in the left diagram, and those from induced cells are shown in the right diagram. Completely unedited sequences were omitted from the graph. (B) Quantitation of the length of junction regions in RPS12 clones shown in A. The length of the junction is defined as the number of potential editing sites (PESs), positions between nonuridine nucleotides, within the sequence. The percentage of clones represented by each slice is shown in the pie graph. (C) Graphic representation of a portion of the sequences of all RPS12 cDNA clones in which full editing terminates before nucleotide (nt) 285 in uninduced (top) and induced (bottom) TbRGG2 RNAi cells. Edited indicates fully edited sequence. (D) Graphic representation of a portion of the sequences of all RPS12 cDNA clones in which full editing terminates between nt 150 and 160 in uninduced (top) and induced (bottom) TbRGG2 RNAi cells. (E) Regions of the edited RPS12 mRNA, where editing preferentially accumulates, aligned with cognate gRNA. The gRNA, gCR6[64], is aligned on the bottom of the RPS12 mRNA region with editing terminating at nt 154 (top). A predicted gRNA is aligned on the bottom to the RPS12 mRNA region with editing terminating at nt 285 (bottom). In the RPS12 sequence, uppercase letters represent bases present in the DNA and lowercase u's represent uridines added during editing. (|) represents a Watson-Crick base pair; (:) represents a G-U base pair; and X represents a mismatch.




