


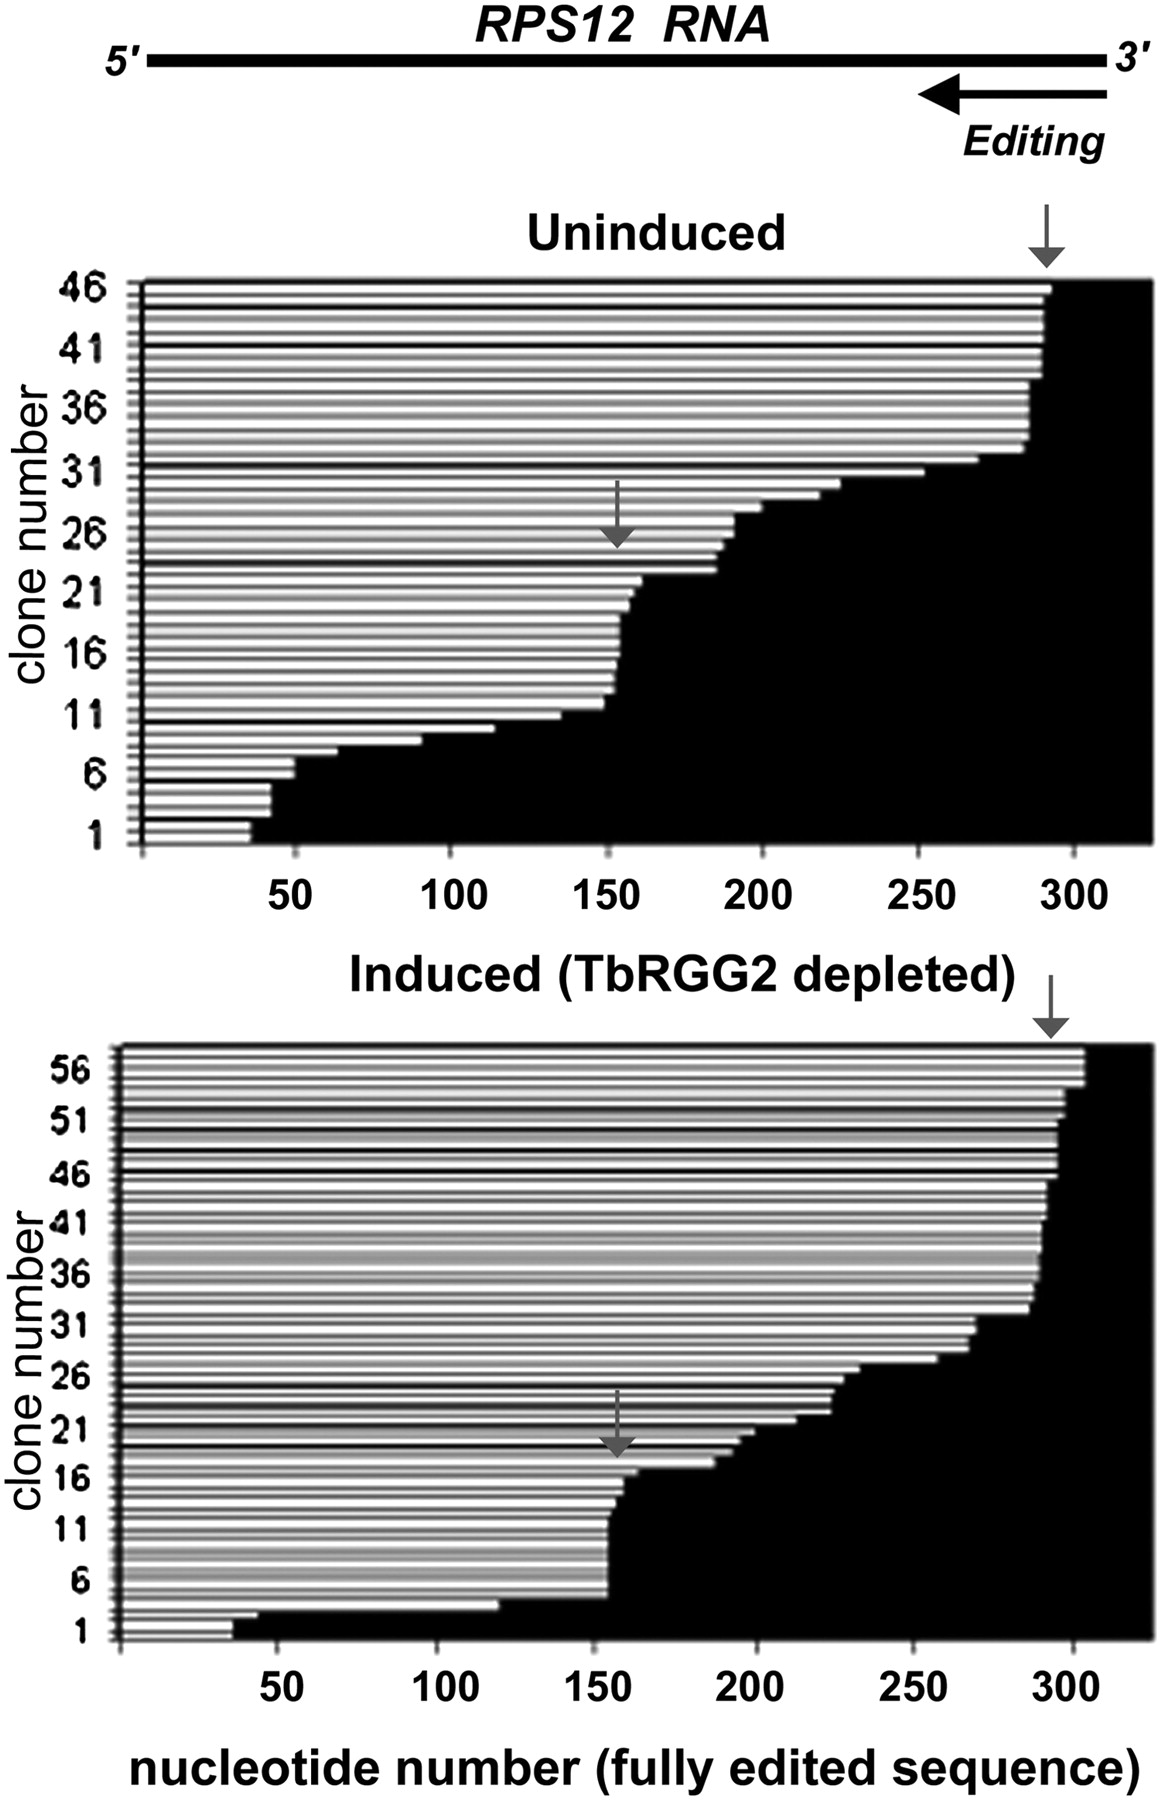
FIGURE 5.
Analysis of cDNA sequences obtained from RT-PCR amplification of RPS12 RNAs from TbRGG2 RNAi cells. RPS12 RT-PCR reactions shown in Figure 4 were cloned and sequenced. Black bars represent regions of fully edited sequence in RPS12 cDNAs relative to the fully edited RPS12 sequence. The nucleotide number of the fully edited sequence is shown on the bottom. cDNAs isolated from uninduced cells are shown in the top diagram, and those from induced cells are shown in the bottom diagram. Completely unedited sequences were omitted from the graph. Gray arrows indicate the predominant stall sites around nucleotides 154 and 285.




