


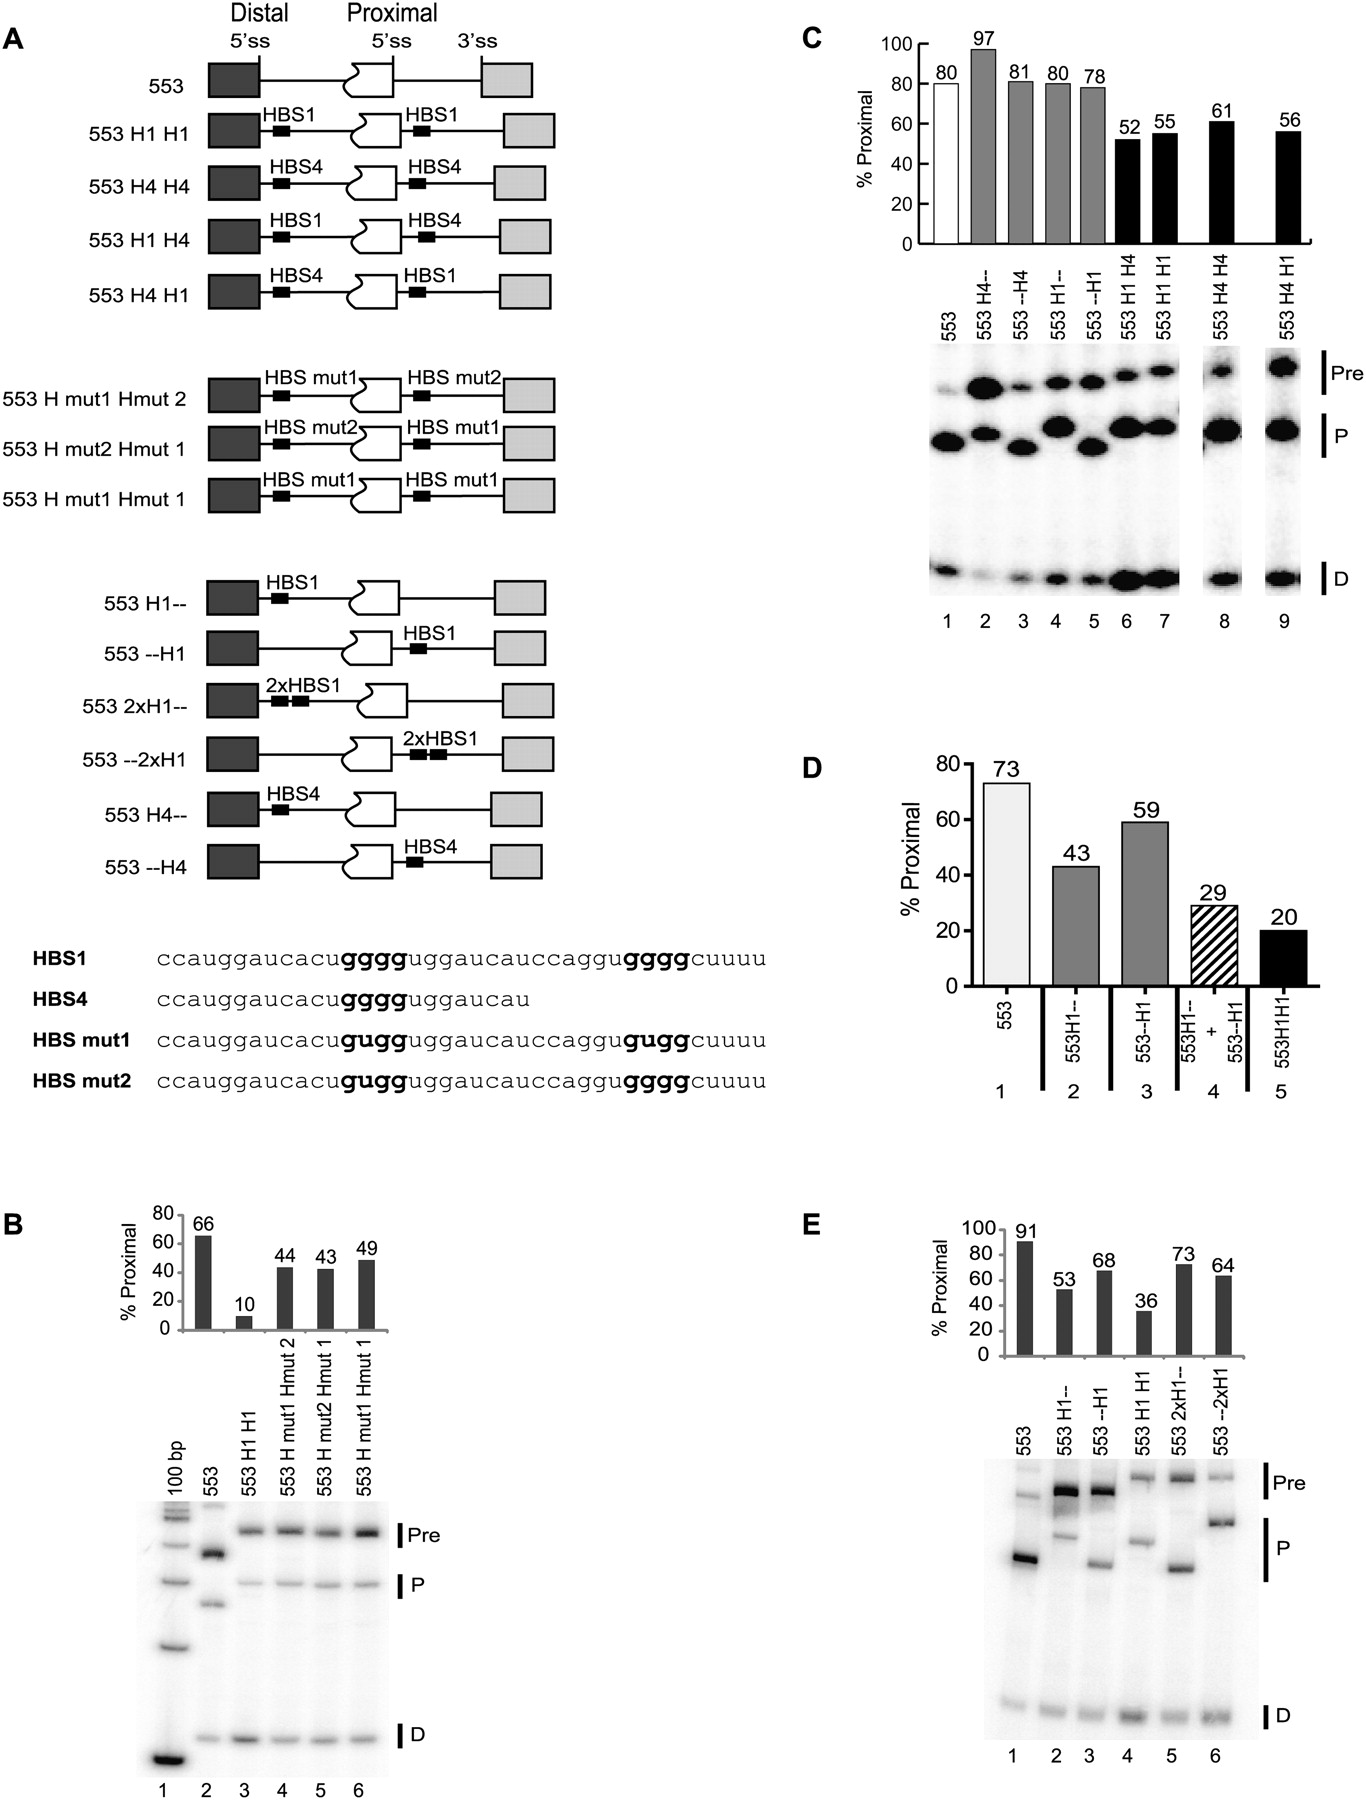
Impact of G-tracts on distal 5′ splice site utilization. (A) Schematic representation of pre-mRNAs containing HBS4, HBS1, or mutated HBS1 (HBSmut1 and HBSmut2). (B–E) Pre-mRNAs were incubated in HeLa nuclear extract at 30°C for 2 h and splicing products were amplified by RT-PCR. Amplicons were separated on gels and splicing products corresponding to distal (D) or proximal (P) 5′ splice site usage or to pre-mRNAs (Pre) are indicated in panels B, C, and E. The 100-bp caption in panel B indicates molecular weight markers. The percentage of proximal products relative to the sum of the proximal and distal products was calculated. Each splicing reaction performed in panel B was done in triplicate. The P-value for the difference between the wild-type 553 H1H1 and each mutant was smaller than 0.05. In panel D, the splicing assays were done in the presence of 10 pmol of DNA oligo HUMMK containing hnRNP H binding sites. The sum of the impact of HBS1 at the individual position (in percentage of shift) has been calculated and is reported in the hatched histogram.




