


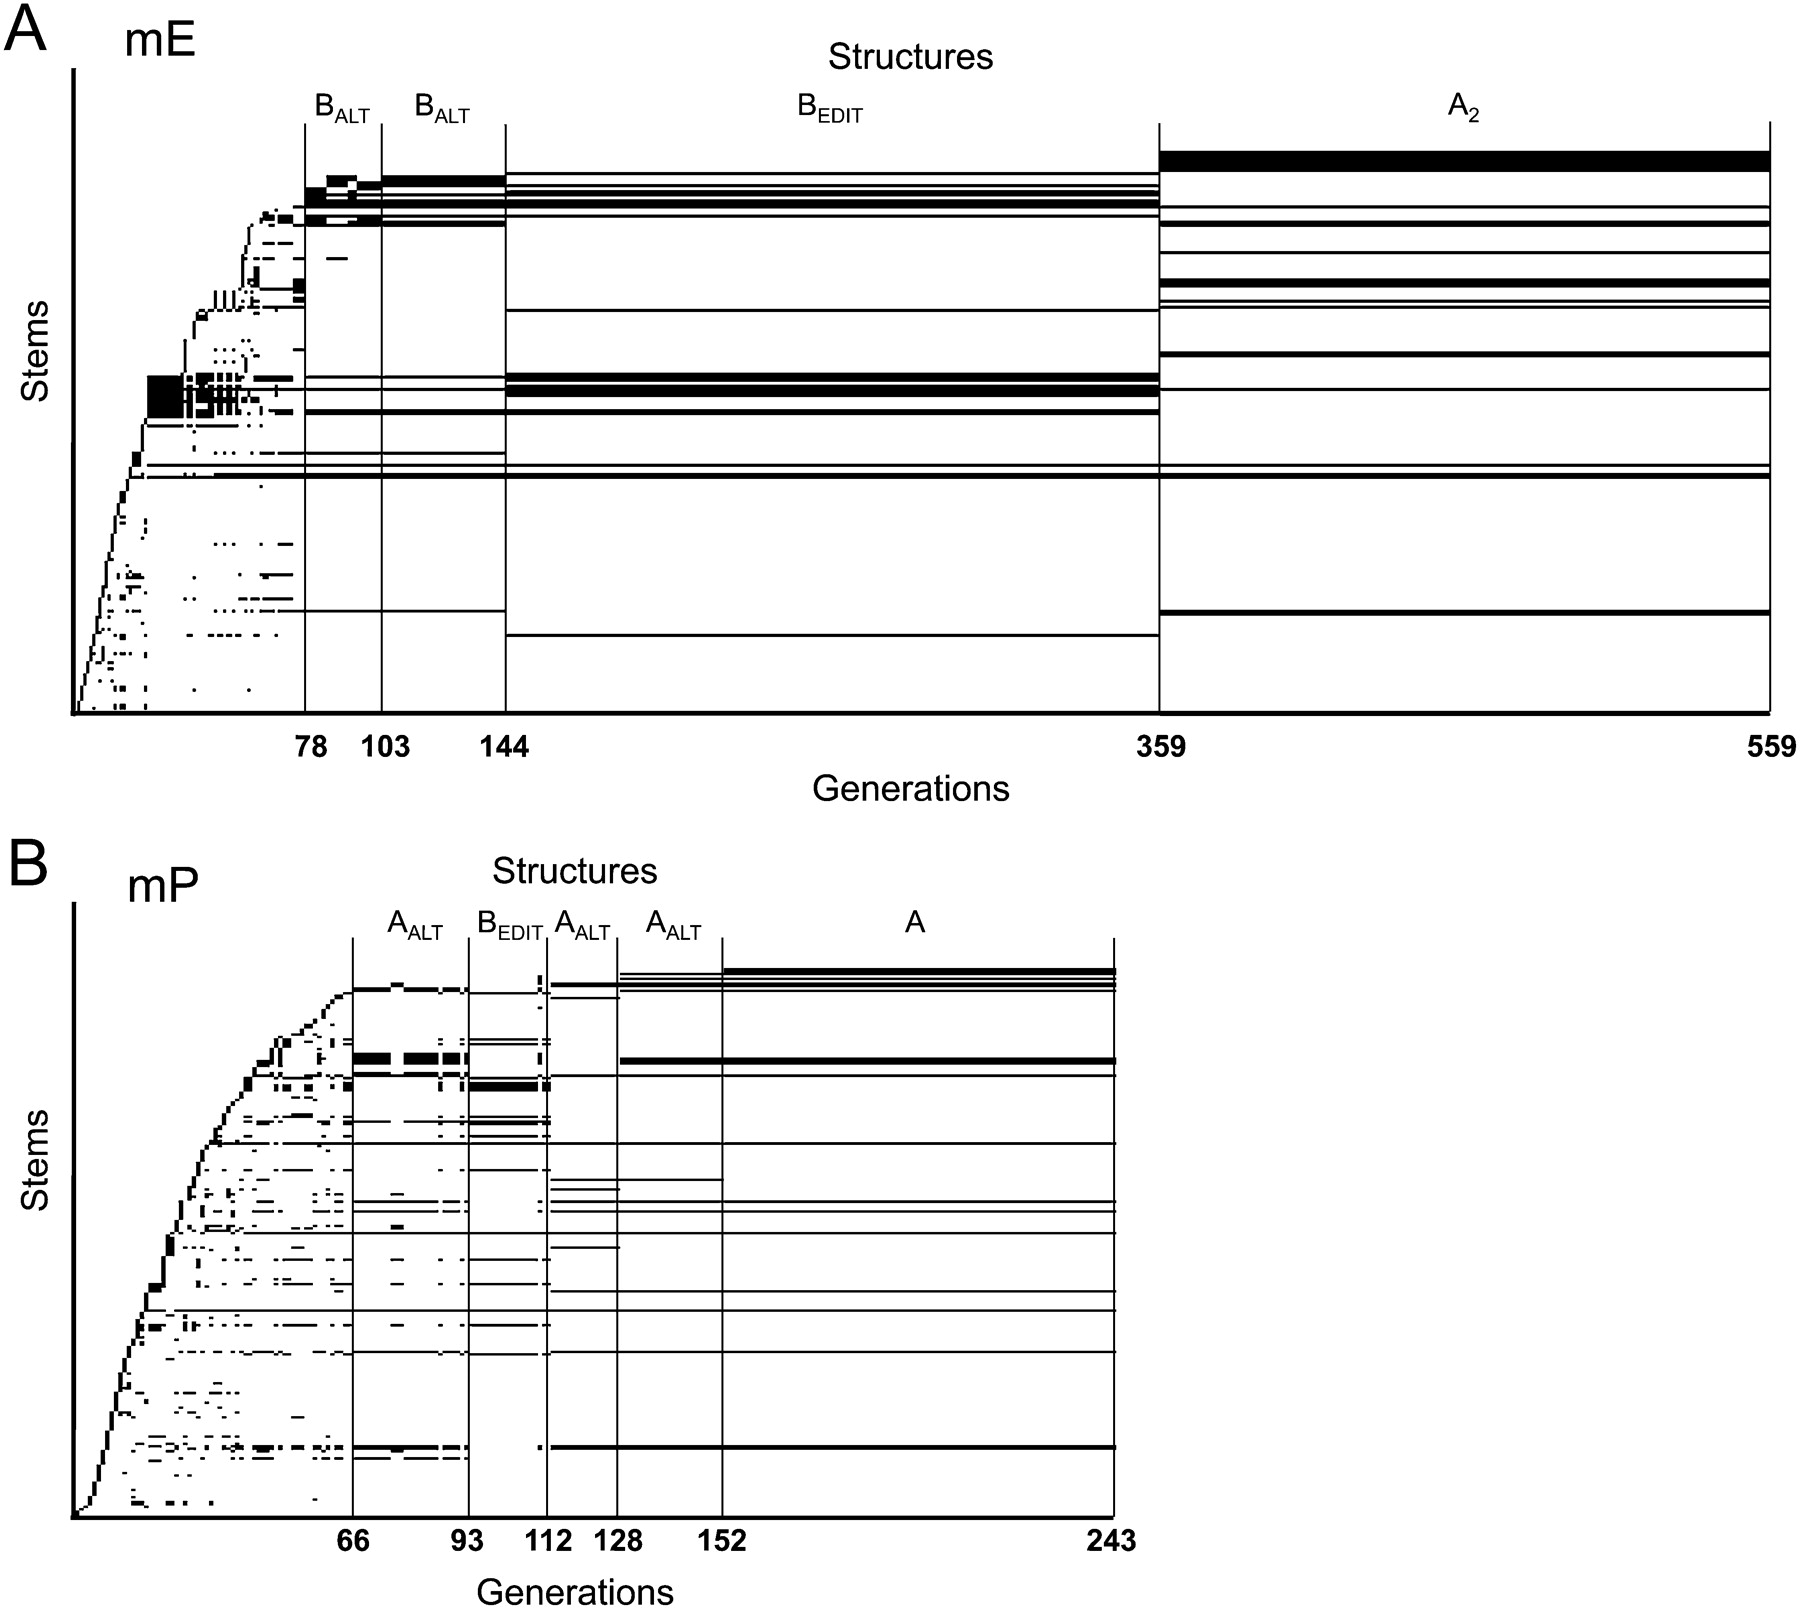
Stem Trace plots illustrating maturation of mE and mP structures in 16K population MPGAfold runs. The population consensus structures are depicted at each run generation, indicated numerically along the horizontal axis, and mature from left to right. Individual secondary structure stem elements (defined by 5′ start position, 3′ stop position, and number of base pairs) are arranged along the vertical axis, in order of their appearance in the consecutive predicted consensus structures. Longer horizontal bars indicate the presence of a stem over more generations of a run. The full secondary structure for a generation corresponds to the set of stems with the same x coordinate. Thin vertical lines demarcate stages of maturation during which run generations were dominated by particular structures that are identified by labels above the plot. (A) 16K population folding run for mE RNA. The final state, labeled A2, is a rod structure identical to that previously published (Linnstaedt et al. 2006, Fig. 2 therein). (B) 16K population folding run for mP RNA. Horizontal scales have been adjusted for clarity. Structures marked as AALT are similar to mostly unbranched rod structures previously reported (Linnstaedt et al. 2006), in that they contain a few short side branches. The final structure of this run, labeled A, is also a near-rod conformer similar to one previously observed for mE (Linnstaedt et al. 2006, Fig. 2 therein, structure A1). As a result of the different free energy landscapes of mE and mP, the 16K full-length runs for mP RNA exhibit a shorter-lived transitional BEDIT conformation and converge more rapidly to the final state, as compared with runs for mE.




