


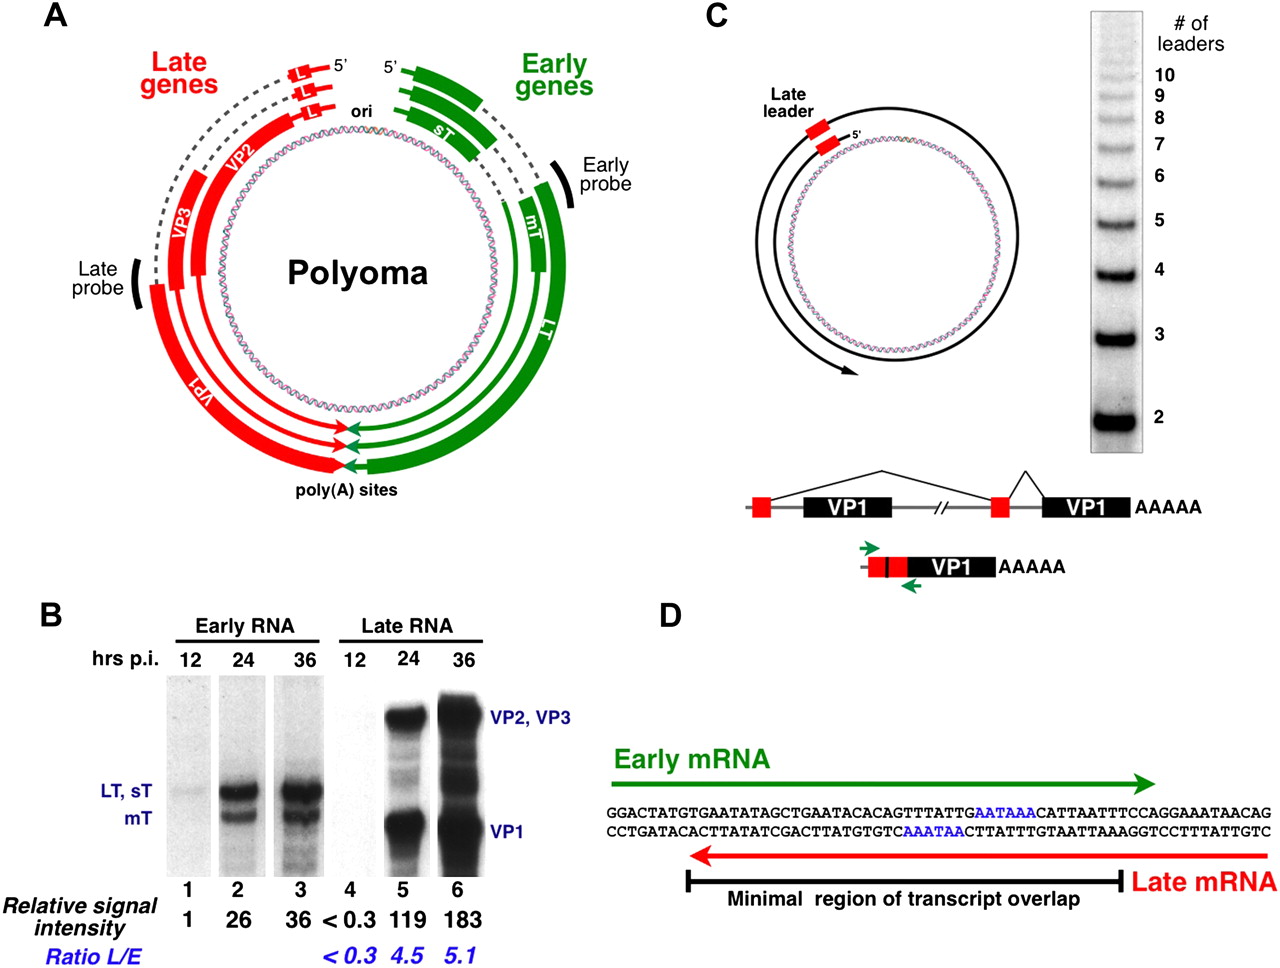
(A) The polyomavirus genome. Early and late genes are transcribed from opposite strands of the genome. (Thick green lines) Coding regions for the early genes (large, middle, and small T antigens); (thick orange lines) coding regions for the late genes (virus capsid proteins VP1, VP2, and VP3). (B) An example of the early-to-late switch. Mouse NIH3T3 cells were infected with wild-type virus and RNase protection assays performed at various times after infection, using probes specific for early-strand and late-strand mRNAs (Hyde-DeRuyscher and Carmichael 1988), which are also indicated in A. Quantitation of bands was done using ImageJ software, with the values for the bands of early RNAs at 12 h after infection arbitrarily set to 1, and all comparisons made to this value. (C) Processing of late pre-mRNAs. Late pre-mRNAs contain tandem copies of the noncoding late leader exon. These exons are efficiently spliced to one another, leading to the further stabilization and processing of late mRNAs (Hyde-DeRuyscher and Carmichael 1988, 1990; Liu and Carmichael 1993). (Bottom) RT-PCR can be used to reveal leader-to-leader splicing. (Right) RT-PCR assay showing that most late mRNAs have multiple tandem leader exons at their 5′-ends. Shown for convenience here are mRNAs with two or more leader exons. (D) Early-strand and late-strand transcripts overlap. While the mRNA 3′-end overlap is 45 bp, primary transcripts likely overlap by a significantly greater extent, leading to the potential for dsRNA formation in the nucleus.




