


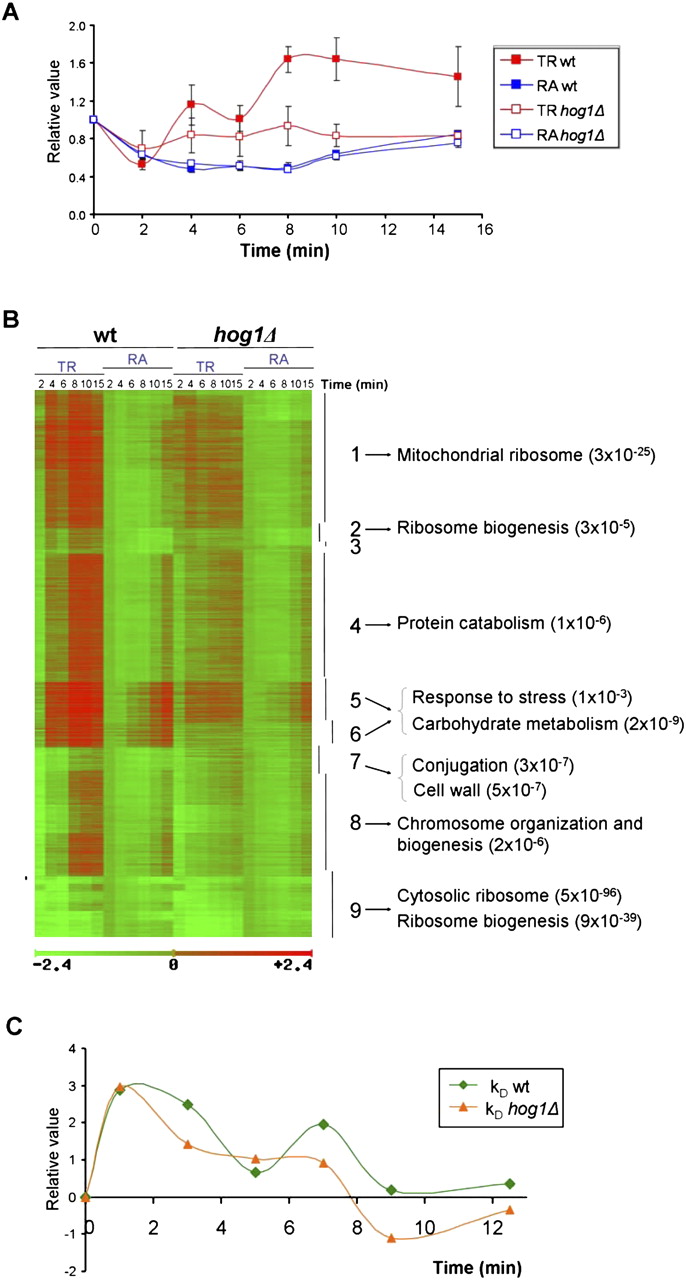
Changes in RNA polymerase II TR and RA during the response to osmotic stress. Wild-type (wt) and hog1Δ cells were grown in YPD until exponential phase and then treated with 0.4 M NaCl. Samples taken at 0, 2, 4, 6, 8, 10, and 15 min of osmotic shock were processed to measure TR and RA of all yeast genes. (A) Changes in global TR and RA after osmotic shock. These two parameters were normalized to an arbitrary value of 1 at t = 0. Error bars represent the standard error of three independent experiments. (B) Clustering of genes according to their TR and RA profiles. Data set series are referred to their respective time 0 in logarithm scale. Relative repression is shown in green and relative induction in red. The most significant gene functional categories for each cluster are shown with their P-values. (C) Changes in global k D values in response to osmotic stress. The graph represents the difference between the mean k D value for all genes at each indicated time and the mean k D value at time 0, divided by mean k D value at time 0. Standard error of the normalized k D deviations was between 0.02 and 0.05 for all time points.




