


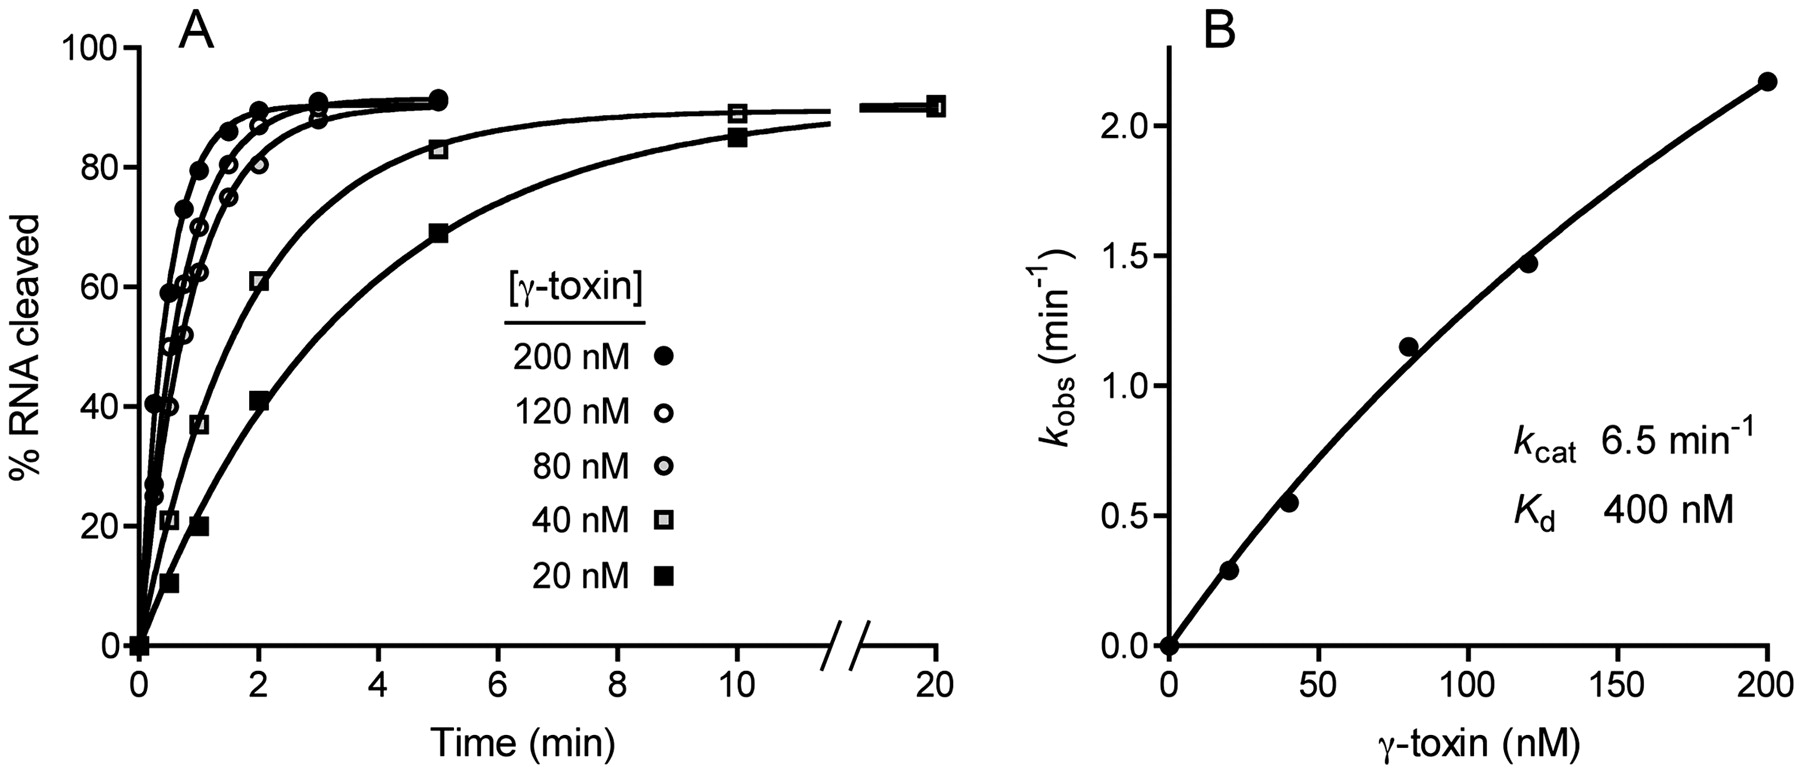
Kinetics of single-turnover RNA cleavage. (A) Reaction mixtures (100 μL) containing 20 mM Tris-HCl (pH 7.5), 2 M TMAO, 20 nM 32P-labeled 17-mer RNA, and 20, 40, 80, 120, or 200 nM γ-toxin were incubated at 4°C. Aliquots (10 μL) were withdrawn at the times specified and quenched with formamide-EDTA. The extent of RNA cleavage is plotted as a function of time for each enzyme concentration. Nonlinear regression curve fitting to a single exponential was performed in Prism. The apparent rate constants derived thereby are plotted in B as a function of γ-toxin concentration. kcat and Kd values were obtained by nonlinear regression curve fitting to a hyperbolic one-site binding model in Prism.




