


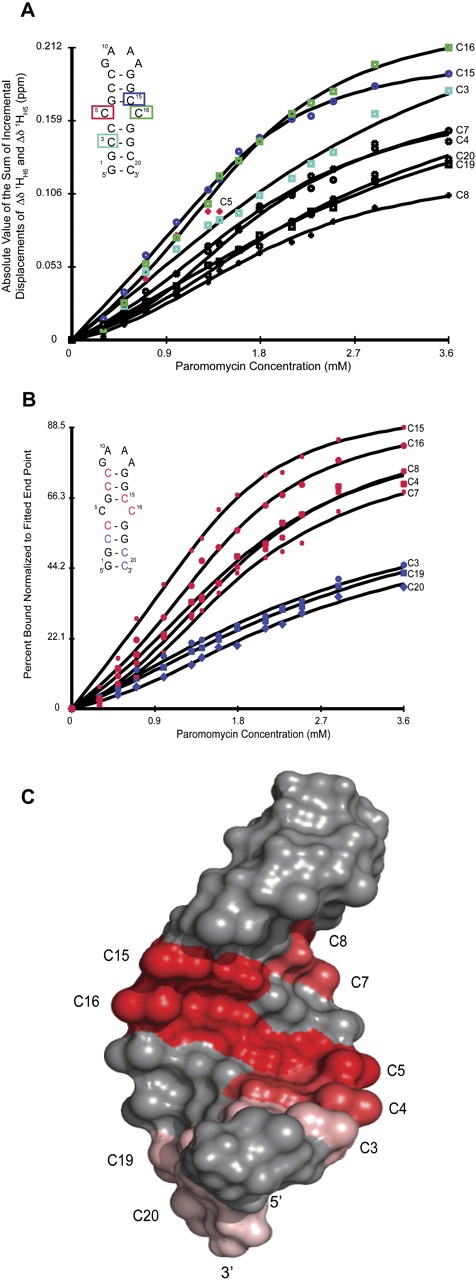
Fit of the chemical shift perturbations for TSMC binding paromomycin. (A) Direct plot of the sum of the incremental displacements for the H6/H5 correlations for all of the cytosine residues of TSMC. The four cytosine nucleotides that move most upon paromomycin binding are shown in color, C16 (green), C15 (blue), C5 (red), and C3 (cyan). Note that C5 disappears due to line broadening at titration point 6 (1.4:1, paromomycin:TSMC). (B) Plot of percent bound normalized to the fitted end point of each cytosine residue. The nucleotides C4, C7, C8, C15, and C16 experience the highest levels of paromomycin saturation and are shown in red. The residues C3, C19, and C20 are characterized by a much lower degree of saturation at the final paromomycin:TSMC molar ratio of 3.6:1, and are shown in blue. (C) Chemical shift perturbation mapped onto the structure of TSMC. The percent bound by the final titration point is mapped onto the cytosine residues of the TSMC structure using a red color gradient. C5, the residue that line broadens and disappears is shown in red here. A high affinity site is located at the CC mismatch and is characterized by a concentration of residues in dark red. The lower affinity site is near the base of the stem and is marked by residues in pink.




