


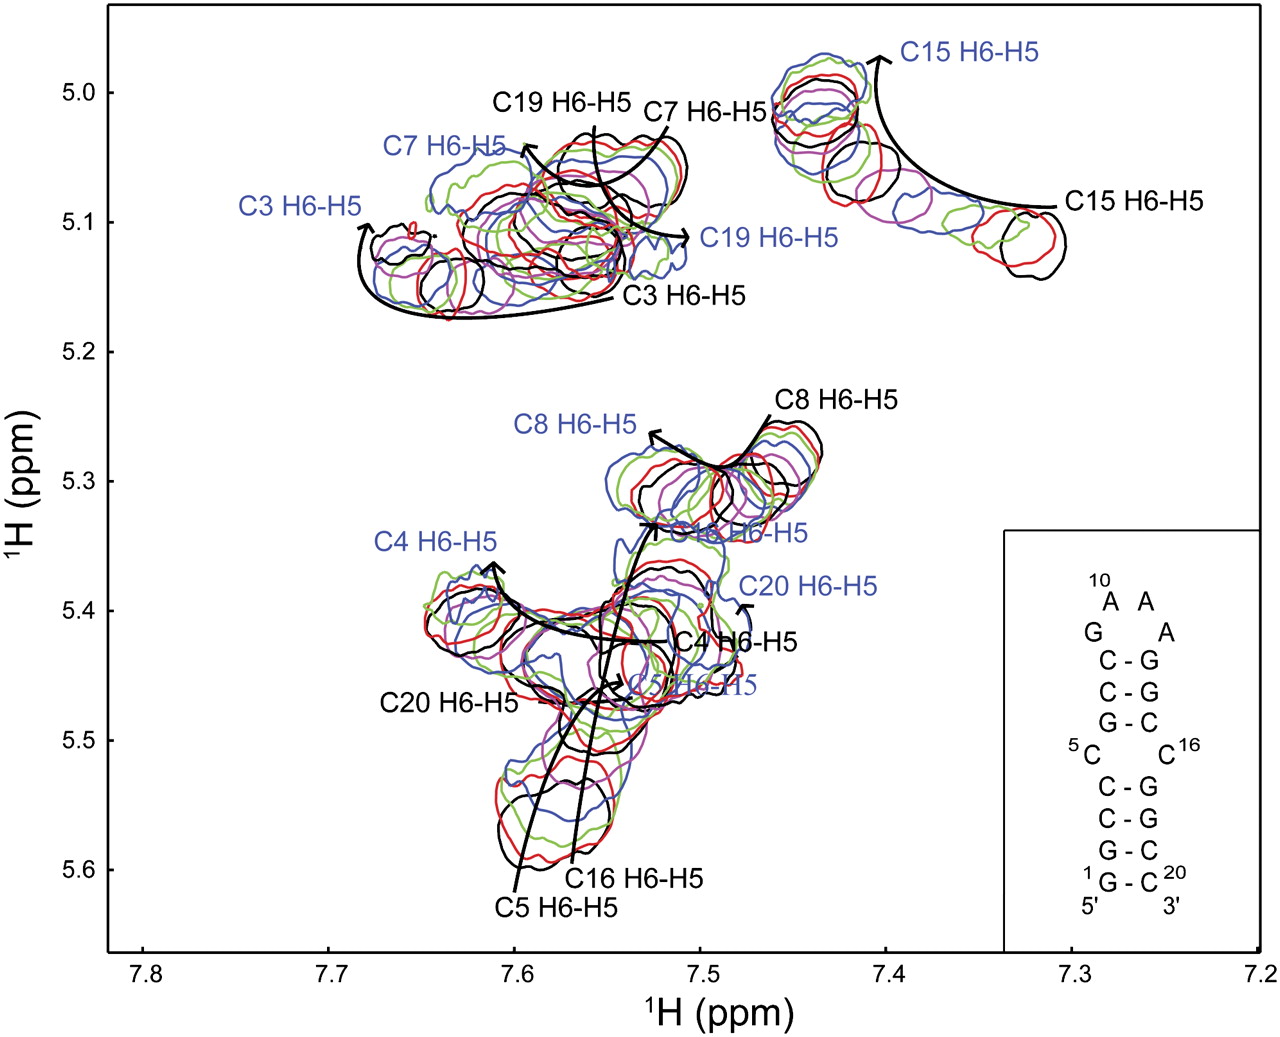
FIGURE 6.
NMR analysis of paromomycin binding to TSMC RNA. An overlay of 2D TOCSY spectra of TSMC acquired at paromomycin:TSMC molar ratios of 0:1, 0.3:1, 0.5:1, 0.7:1, 1:1, 1.3:1, 1.4:1, 1.6:1, 1.8:1, 2.1:1, 2.3:1, 2.5:1, 2.9:1, and 3.6:1. The colors are shown in a repeating cycle of black, red, green, blue, and magenta. The arrows indicate the direction of the peak shift, with the free assignments in black and bound assignments in blue type. The inset shows the secondary structure of the TSMC RNA. Spectra were acquired in 10 mM sodium phosphate at pH 6.4, 100 μM EDTA at 20°C in 99.9% 2H2O.




