


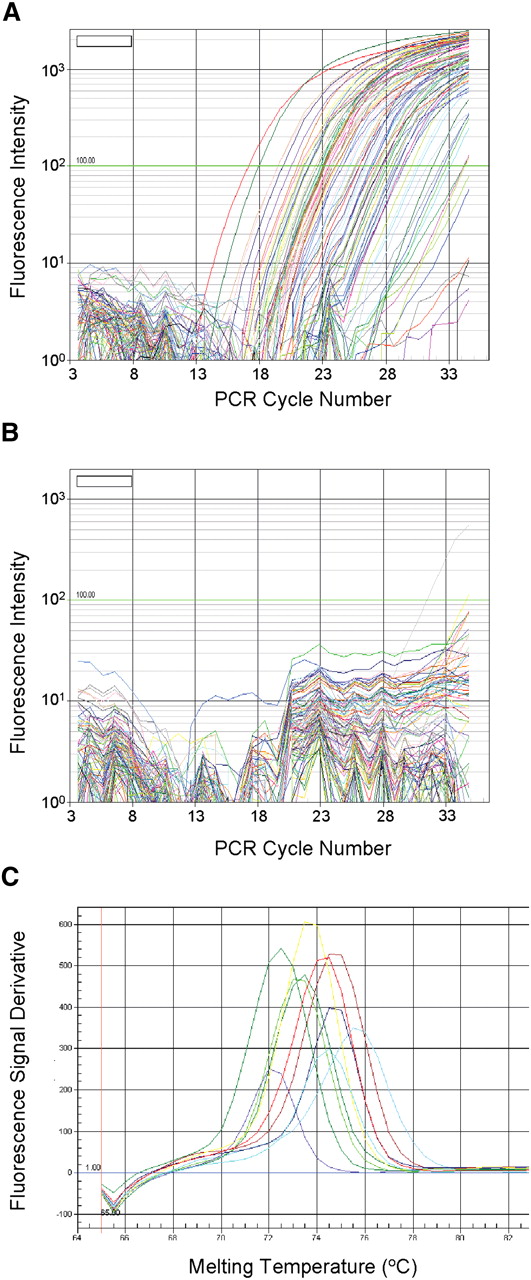
FIGURE 4.
Real-time RT-PCR validation of 96 cancer-related miRNA assays. (A) Real-time RT-PCR was performed with the total RNA extracted from a frozen cervical tumor tissue. Each line in the plot represents the amplification curve for one miRNA. (B) Real-time RT-PCR was performed with the total RNA from E. coli. (C) Melting curve analysis of the real-time PCR profile for the cervical tissue miRNAs. For illustration purpose, only 10 dissociation curves are displayed here for 10 of the 96 miRNA assays. Other dissociation curves (data not shown) were similar to those presented here.




