


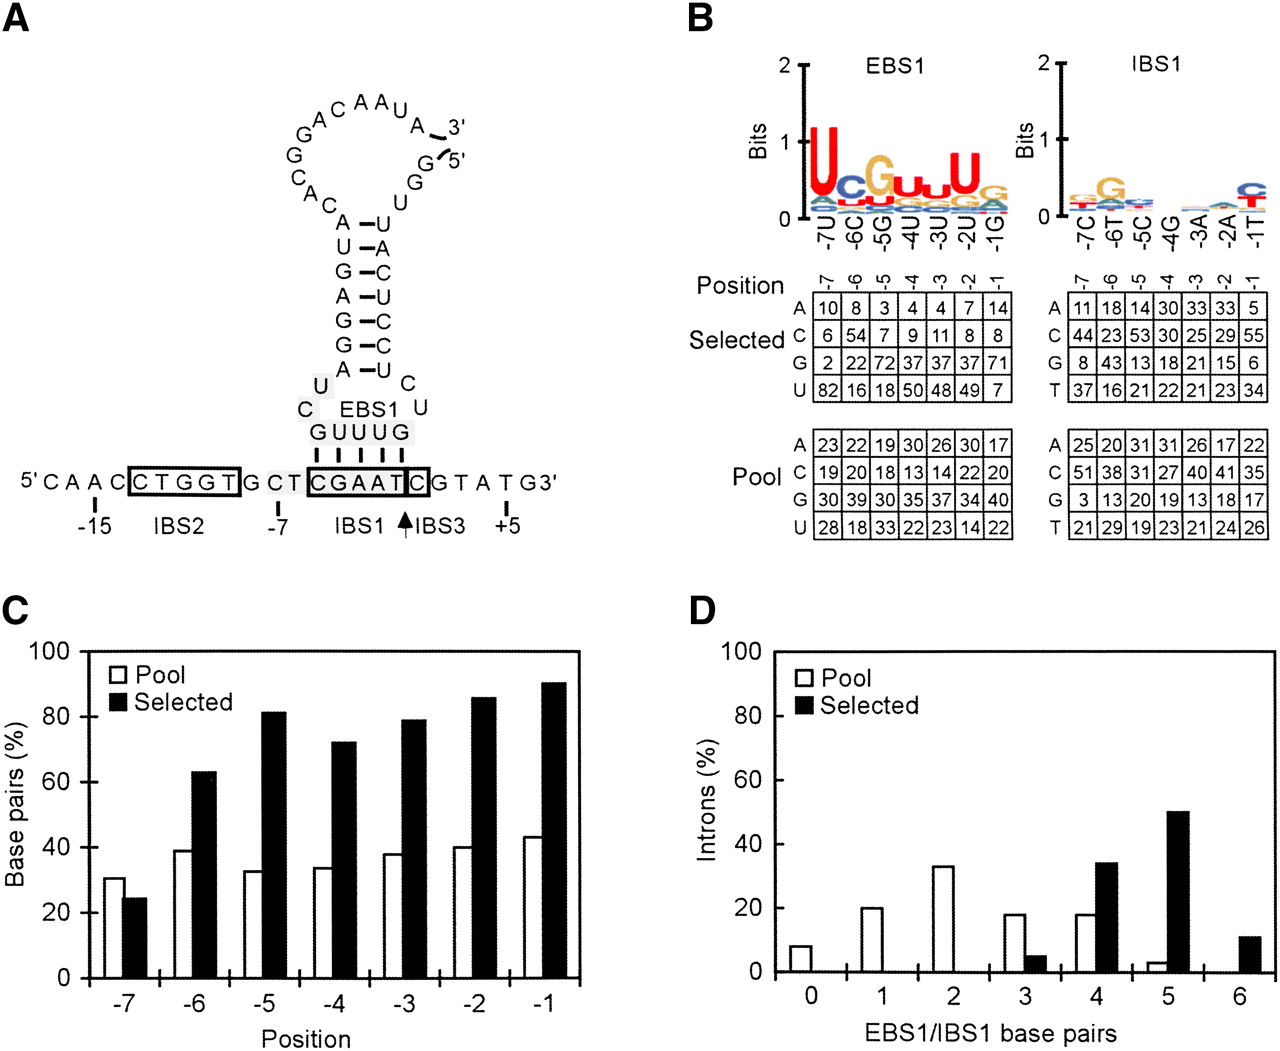
Analysis of EcI5 DNA target site EBS1/IBS1 base-pairing interactions. A selection experiment was done using a pBRR3-EcI5-based recipient-plasmid library with random nucleotide residues at DNA target site positions −7 to −1 and a pACD2-EcI5 based donor-plasmid library with random nucleotide residues at the corresponding positions in the EBS1 stem–loop. The IBS1 positions in the 5′-exon of the donor plasmid were also randomized to provide complementary nucleotide combinations for RNA splicing. The selection was done as in Figure 5, except that IPTG induction of the donor plasmid library, which decreased cell viability, was replaced with a 1-h incubation at 37°C in the absence of IPTG. After plating the cells on LB agar containing tetracycline, ampicillin, and chloramphenicol, colonies containing recipient plasmids with integrated introns were picked, and the region from 5′-exon position −210 to intron position +505 was amplified by colony PCR using primers ForpBRR and EcI5AVA2AS and sequenced using primer Rseq (see Supplemental Table 2). (A) Predicted EBS1/IBS1 base-pairing interactions between the intron RNA and the top strand of the DNA target site. The nucleotide residues randomized in the selection are highlighted in gray. The arrow indicates the intron-insertion site. (B) WebLogo representation of nucleotide frequencies at randomized positions in 87 selected integration events, corrected for biases in the initial pools based on sequences of 94 unselected donor and 95 recipient plasmids from the initial pools. Nucleotide frequencies (percent) at each position in the selected and unselected plasmids are summarized below. In some cases, percentage totals do not equal 100 due to rounding off. (C) Percentage of base pairs at each EBS1/IBS1 position in 87 selected integration events (black bars) and 94 randomly paired donor and recipient plasmids from the initial pools (white bars). (D) Percentage of introns that have different numbers of EBS/IBS1 base pairs with the target site in 87 selected integration events (black bars) and 94 randomly paired donor and recipient plasmids from the initial pools (white bars). In C and D, both Watson–Crick and wobble U•G and G•T pairs are counted as base pairs (Guo et al. 1997; Sugimoto et al. 2000).




