


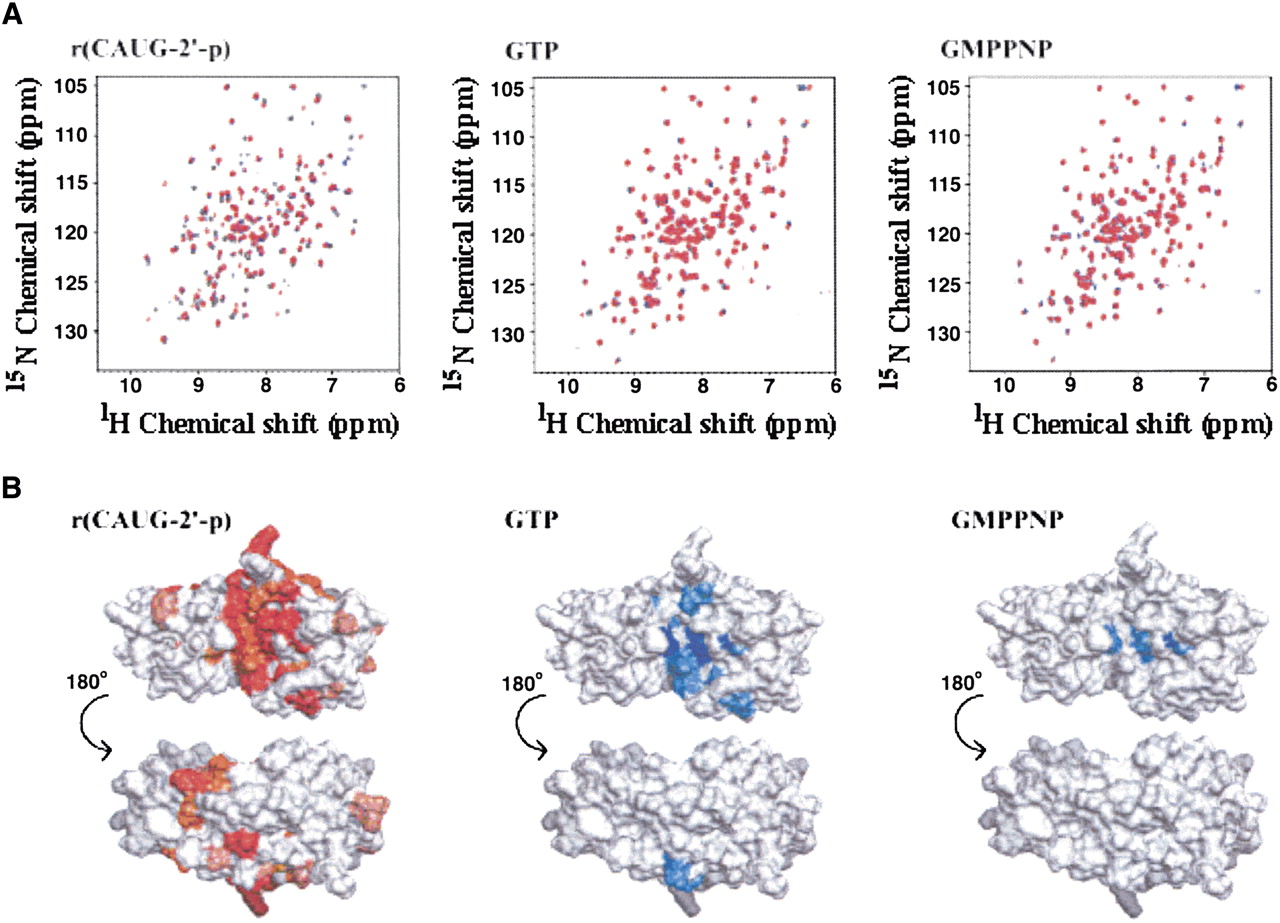
Analysis of interaction between PF0027 protein and substrates. (A) HSQC spectra of PF0027 protein. For r(CAUG-2′-p), uniformly 13C-labeled and 15N-labeled PF0027 protein was used at a concentration of 0.1 mM. For GTP or GMPPNP, uniformly 15N-labeled PF0027 protein was used at a concentration of 0.3 mM. The molar ratios of PF0027 protein and substrates were 0, 0.5, and 1 for r(CAUG-2′-p) and 0, 1, and 3 for GTP and GMPPNP as indicated by black, blue, and red, respectively. (B) Chemical shift changes of NH signals mapped on PF0027 protein structures. For r(CAUG-2′-p) or GTP/GMPPNP, the residues whose signals disappeared are shown in dark red or blue, respectively. Large (>0.05 ppm) and moderate (0.02–0.05 ppm) average amide chemical shifts (Δδav) are indicated by the brightness of the red or blue color of each residue. (White) Residues showing small (<0.02 ppm) or no changes. Changes in the average amide chemical shifts were calculated using Δδav = { 0.5 [(0.2ΔδN)2 + ΔδH2]}½, where ΔδN and ΔδH are the amide nitrogen and amide proton chemical shift differences between the free and bound states of the protein.




