


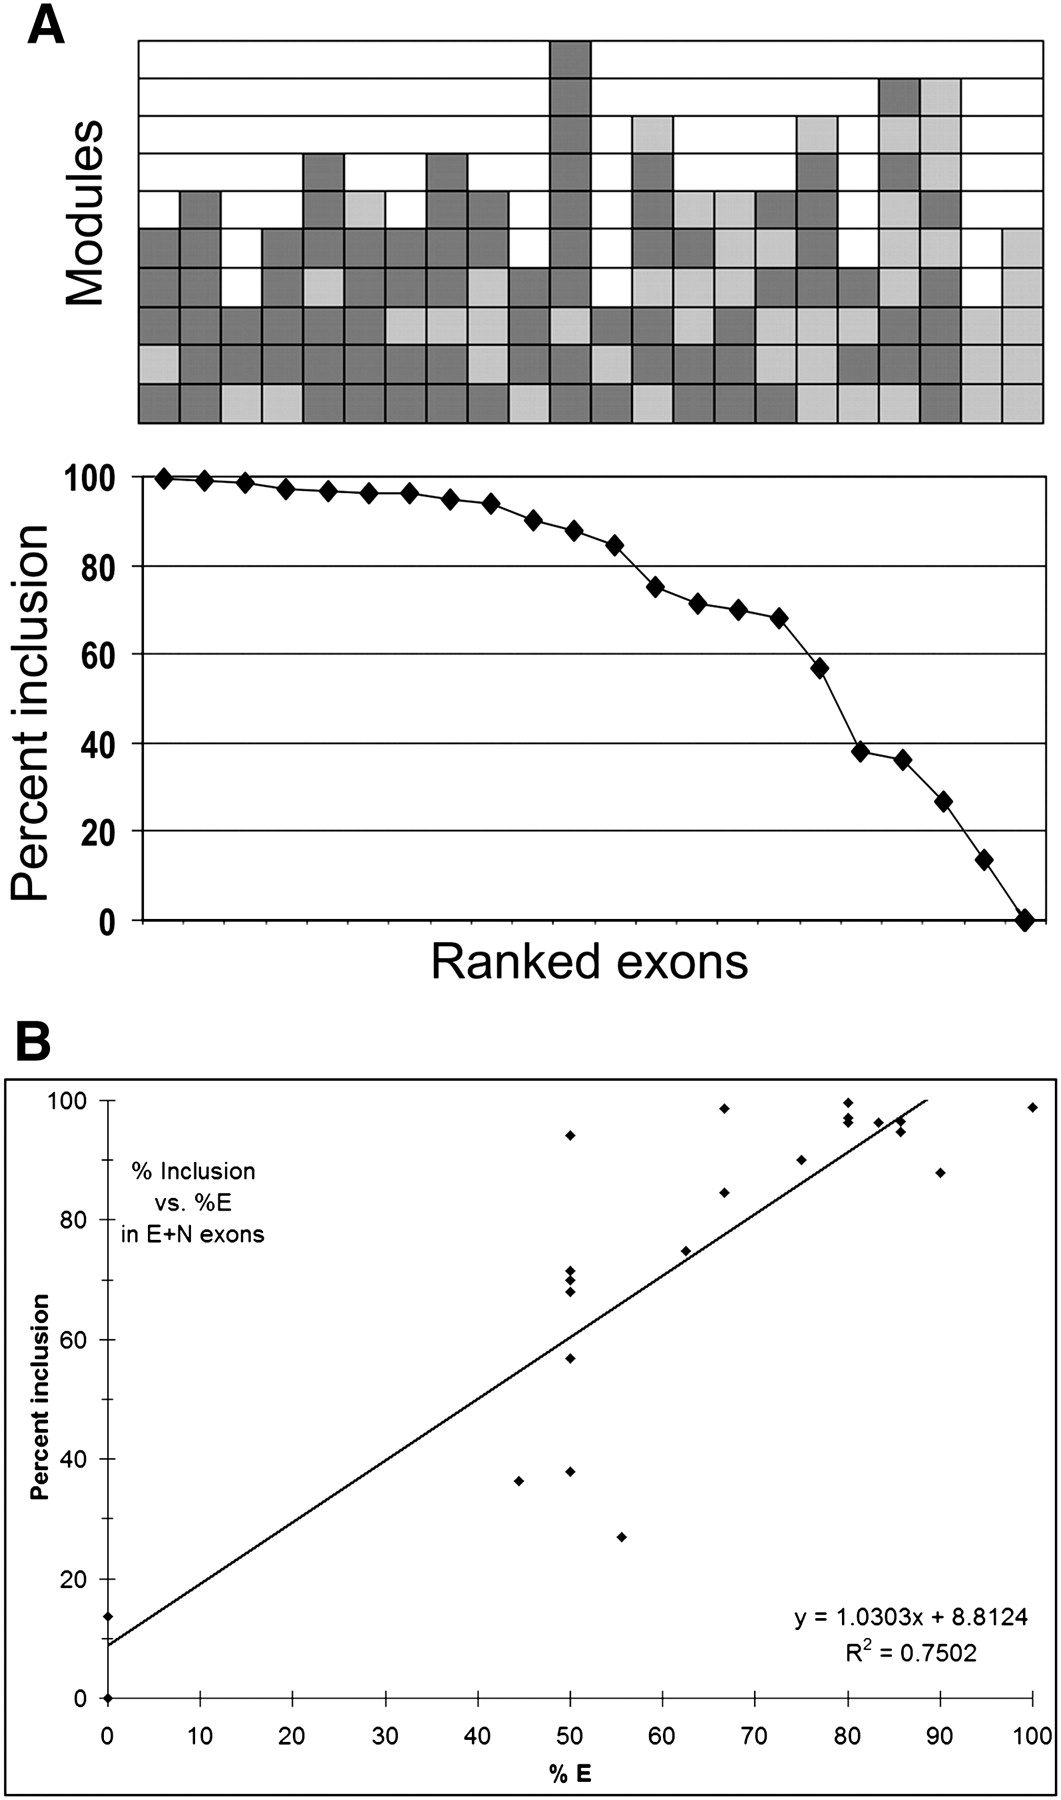
FIGURE 6.
Splicing of exons designed without silencers. (A) Bottom: Splicing of 22 designer exons ranked by percent exon inclusion. Top: Structure of the corresponding designer exons. Each colored rectangle represents an E (dark gray) or N (light gray) module. An additional N module is present between each E and N module but these are not depicted. The 5′ end of the exon is at the bottom. (B) Correlation between exon inclusion and the proportion of E elements in an exon. Exon inclusion levels for these designer exons are presented in tabular form in Supplemental Table 1.




