


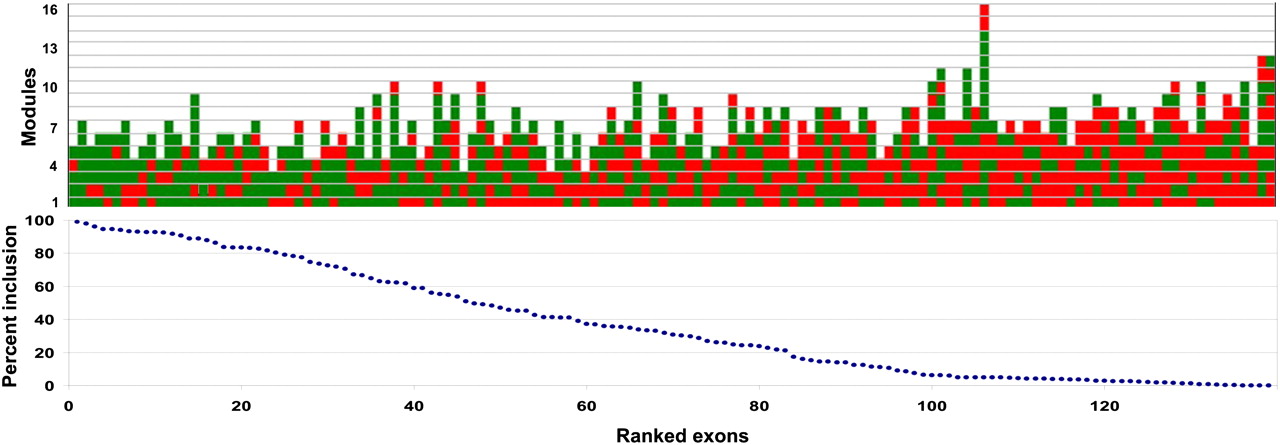
FIGURE 4.
Splicing of designer exons. Bottom: Splicing of 139 designer exons ranked by percent exon inclusion. Exon inclusion is defined as 100 × included/(included + skipped), and the value is the average of at least two independent transfections (average SE = 16%). Top: Structure of the corresponding designer exons. Each colored rectangle represents an E (green) or S (red) module. The 5′ end of the exon is at the bottom. Exon inclusion levels for this designer exon are presented in tabular form in Supplemental Table 1.




