


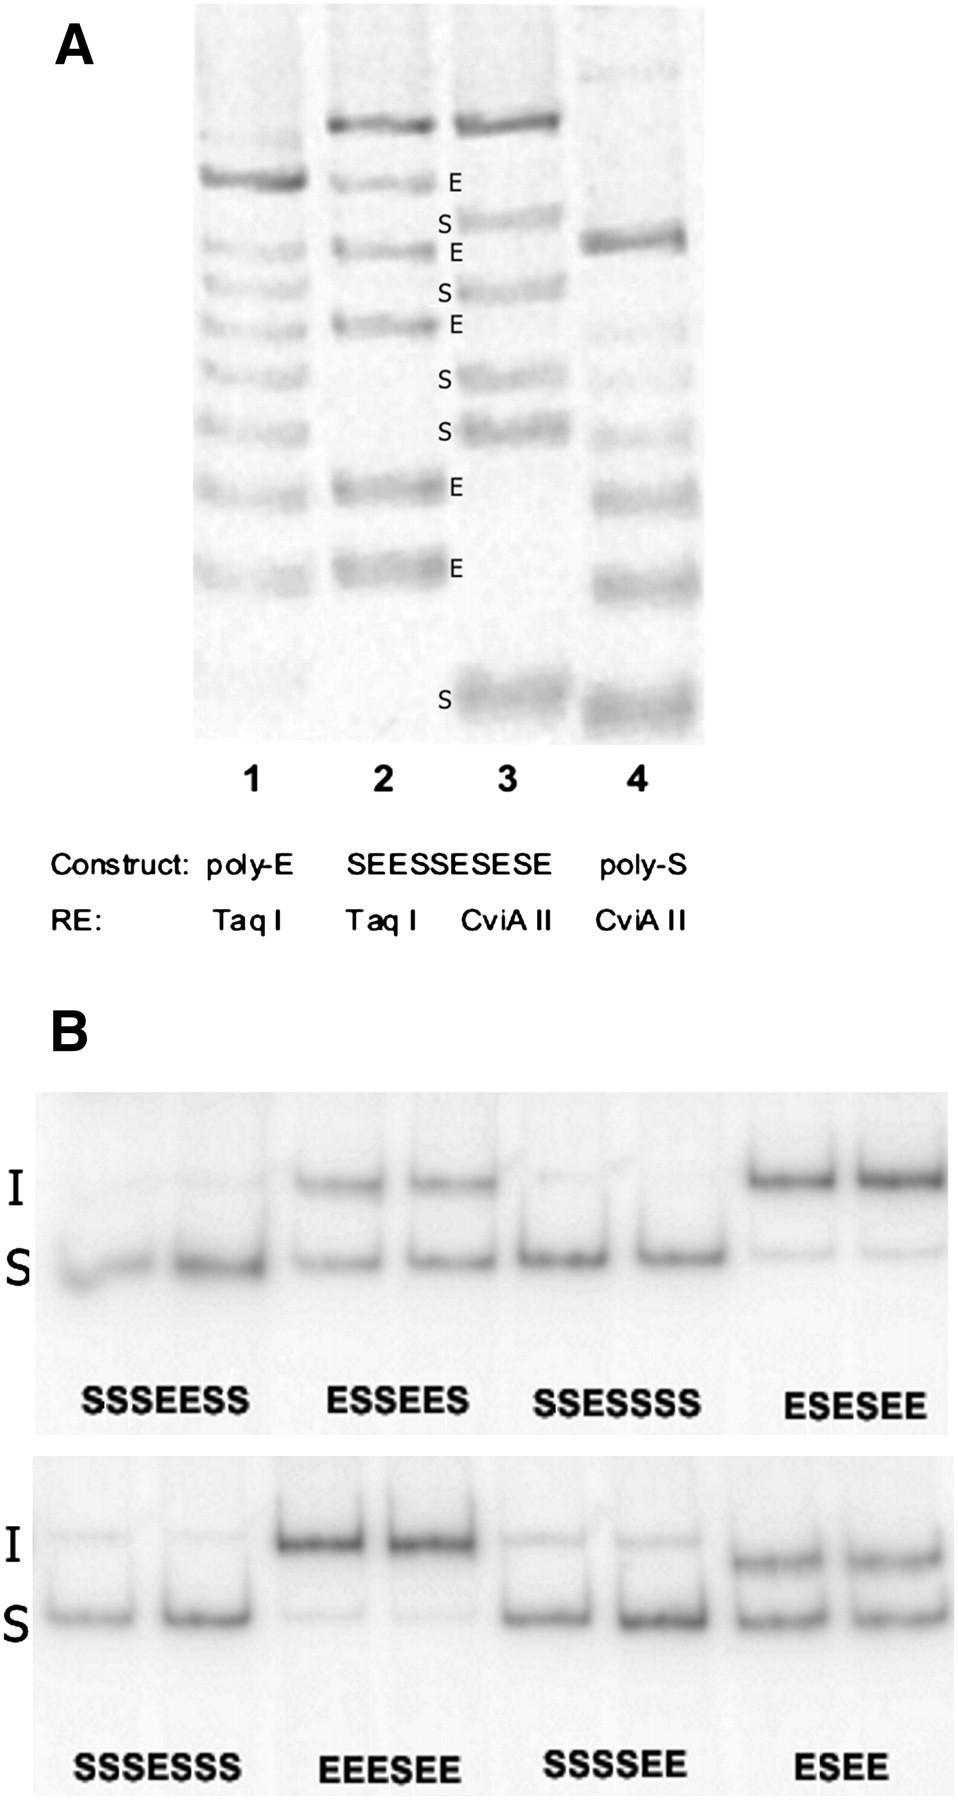
Determination of designer exon genotypes and phenotypes. (A) Module order screening. Plasmid DNA from designer exon clones was PCR-amplified using one fluorescently tagged primer and then cleaved with the diagnostic restriction enzymes (RE) TaqI, which cuts in the E module or CViAII, which cuts in the S module. (Lane 1) A clone with seven E modules and no S modules cut with TaqI; (lane 4) a clone with six S modules and no E modules, cut with CviAII; these lanes serve here as standards. (Lanes 3,4) The same 10-module clone (SEESSESESE) cut with either TaqI (lane 2) or CviAII (lane 3). The relative positions of the bands (labeled E or S) allow the order of E and S modules to be read directly from the gel. All constructs used for analysis were subsequently DNA-sequenced. (B) Splicing phenotype measurement. Plasmids harboring designer exons were transfected into 293 cells and the mRNA products were amplified by radioactive RT-PCR. The relative amounts of molecules that included (I) or skipped (S) the designer exon were determined by Phosphorimaging. The analysis of eight representative clones is shown, with two independent transfections for each clone. The sequence of modules present in each exon is shown below each pair of lanes.




