


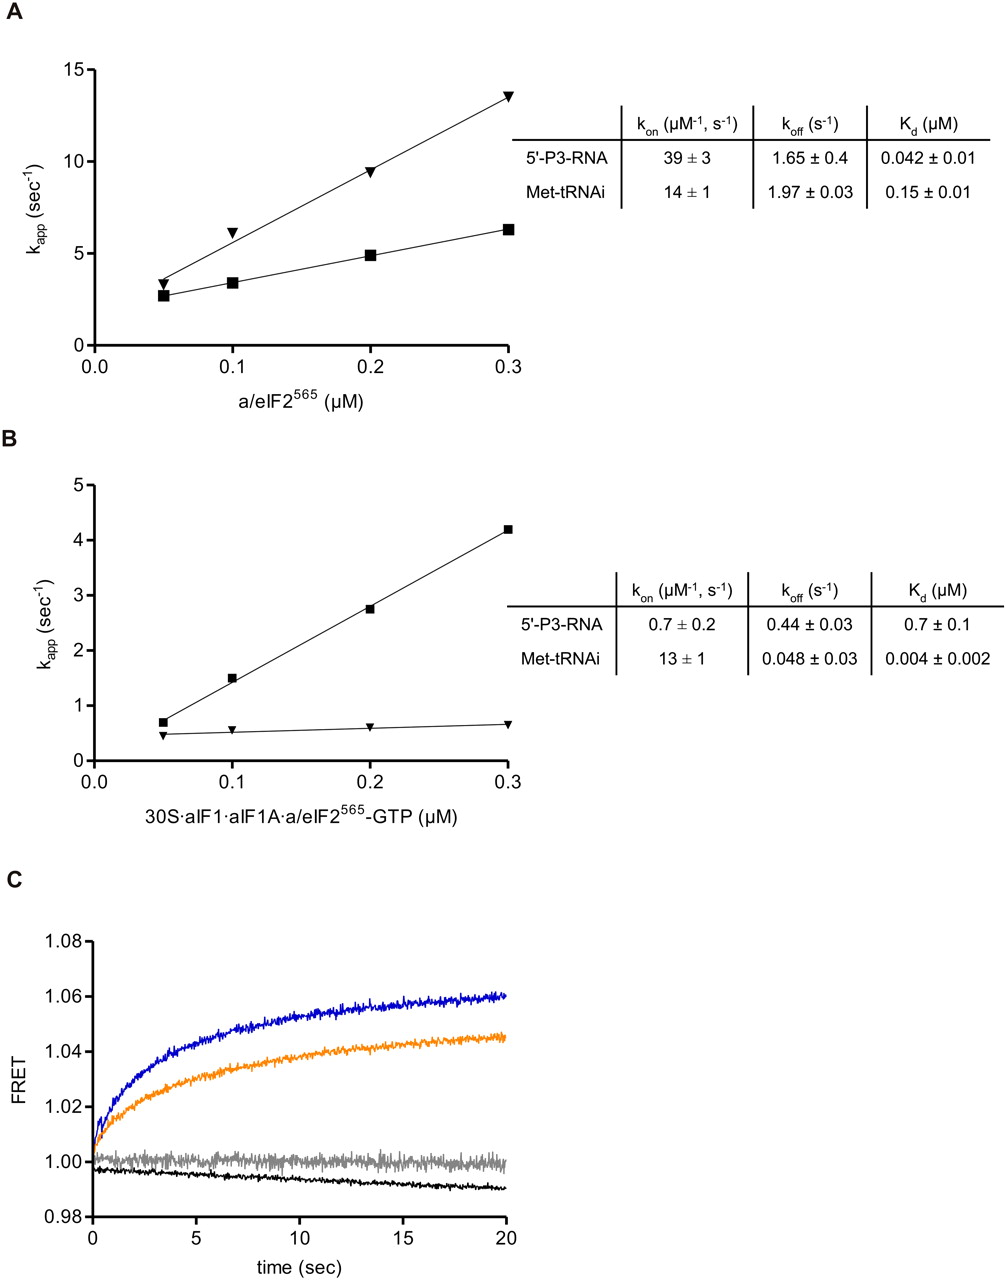
Association of a/eIF2 with different binding partners. (A) The kon values for a/eIF2565 binding to Met-tRNAiFMet (■) and to 5′-P3-2508shF RNA (▼) were determined by titration of the respective kapp values obtained at different concentrations of a/eIF2565. (B) The kon values for Met-tRNAiFMet (■) and 5′-P3-2508shF RNA (▼) binding to a 30S•aIF1•aIF1A•a/eIF2565-GTP complex were determined by titration of the respective kapp values obtained at different concentrations of the 30S•aIF1•aIF1A•a/eIF2565-GTP complex. The charts in A and B show the kon, koff, and Kd values determined as described in Materials and Methods. (C) 30S•a/eIF2 binding to Met-tRNAiFMet (blue trace) and to equimolar concentrations (see Materials and Methods) of Met-tRNAiFMet and 5′-P3-2508sh RNA (orange trace). Control measurements were performed with unlabeled AUG-mRNA and labeled a/eIF2565 (black trace, acceptor only) or with labeled Met-tRNAiFMet and unlabeled a/eIF2 (gray trace, donor only). As donor and acceptor were stable under the experimental conditions, the downward slope of the two control curves may reflect photobleaching.




