


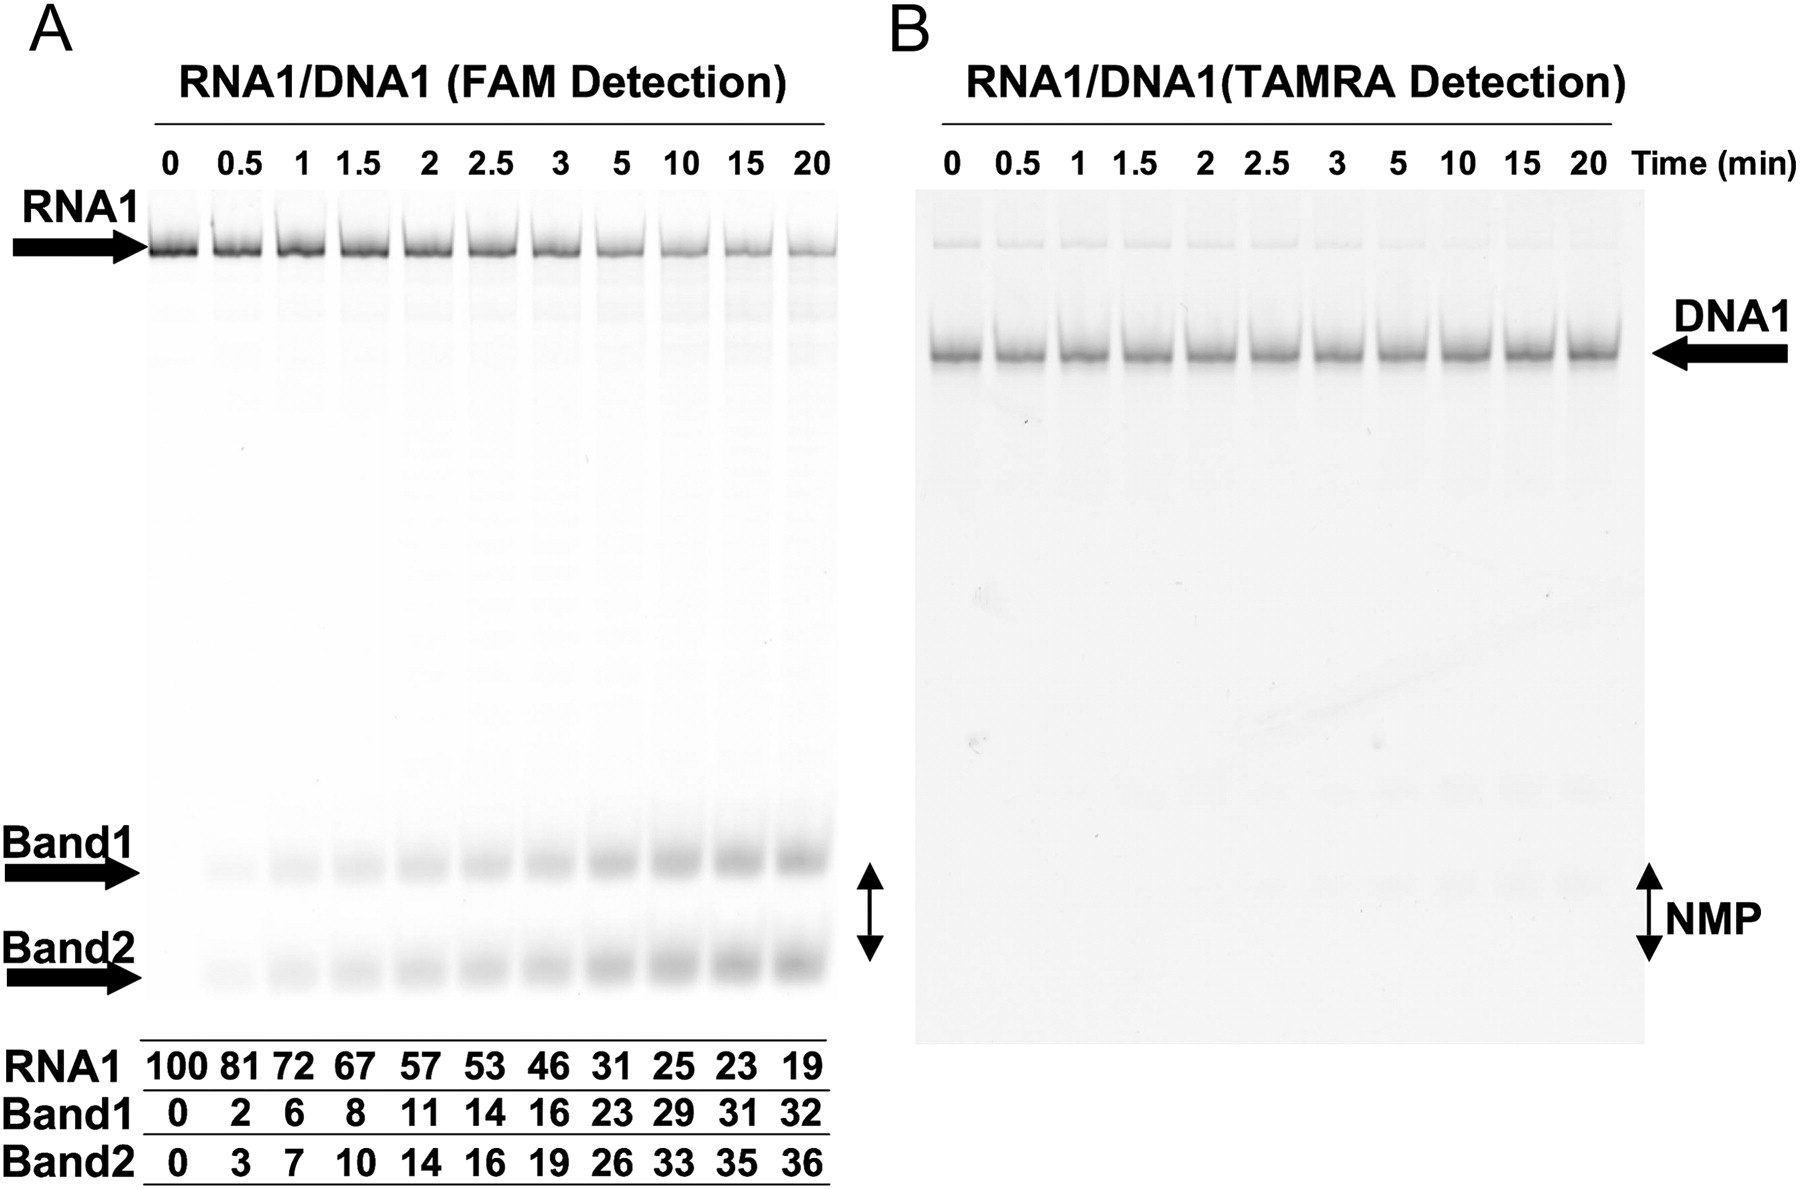
Typhoon analysis of the products of the RT-FeDEx reaction. Separation on 20% polyacrylamide gel (5 M urea). (A) The gel was scanned on a Typhoon to detect the fluorescence associated with FAM. RNA1 is principally digested to the size of short oligonucleotides linked to FAM; Bands 1 and 2 are likely to correspond to very short oligoribonucleotides linked to FAM, one or two cytosines linked to FAM if we consider that FAM molecules are expected to not strongly alter the migration of linked nucleotides. The position of the migration of radiolabeled UMP or GMP is indicated by a double arrowhead and NMP. Results of a quantification of FAM-associated bands 1 and 2 and full-length RNA1 are shown at the bottom in A in percentage of the full-length RNA1 input. Quantification was performed with an Image Quant software; (B) The same gel was scanned to detect the fluorescence associated with TAMRA. The TAMRA-linked DNA remains intact during the assay. Xylene cyanol and bromophenol blue are not present in the loading buffer in order to prevent a parasitic fluorescence signal. Faint bands are also due to some emission of fluorescence of FAM at 580 nm.




