


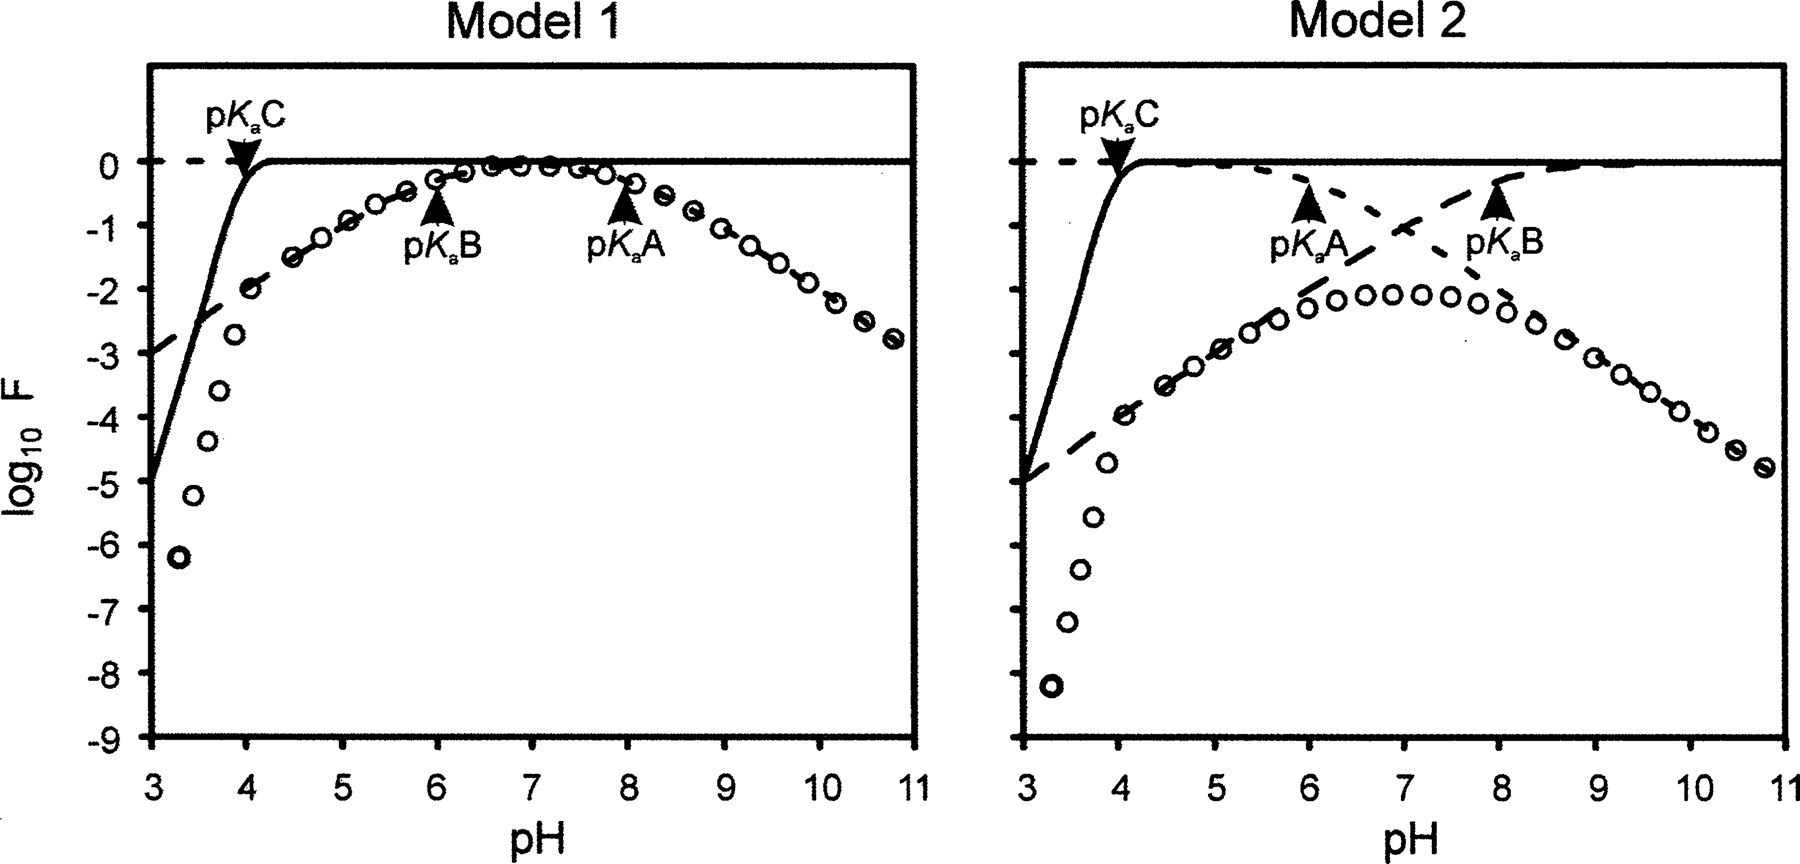
Simulations showing the effect of pH on the proportion of RNA in the state capable of participating in catalysis for Models
1 and 2 (see Materials and Methods). The figure shows individual plots of log10 of the fraction of RNA (F) in which the general acid (
 , short dashed line) or general base (
 , long dashed line) are in the appropriate protonation state to participate in catalysis as a function of pH; in Model 1,
the general base pK
aB = 6 and the general acid pK
aA = 8; in Model 2, the general base pK
aB = 8 and the general acid pK
aA = 6. A third plot (solid black line) describes the fraction of RNA that retains critical tertiary interactions (f
C) that are disrupted below an apparent pK
aC = 4 and n = 5 (see Materials and Methods). Multiplying the three proportions
, long dashed line) are in the appropriate protonation state to participate in catalysis as a function of pH; in Model 1,
the general base pK
aB = 6 and the general acid pK
aA = 8; in Model 2, the general base pK
aB = 8 and the general acid pK
aA = 6. A third plot (solid black line) describes the fraction of RNA that retains critical tertiary interactions (f
C) that are disrupted below an apparent pK
aC = 4 and n = 5 (see Materials and Methods). Multiplying the three proportions
 describes F, the overall fraction of RNA in the catalytically competent state at a given pH (○).




