


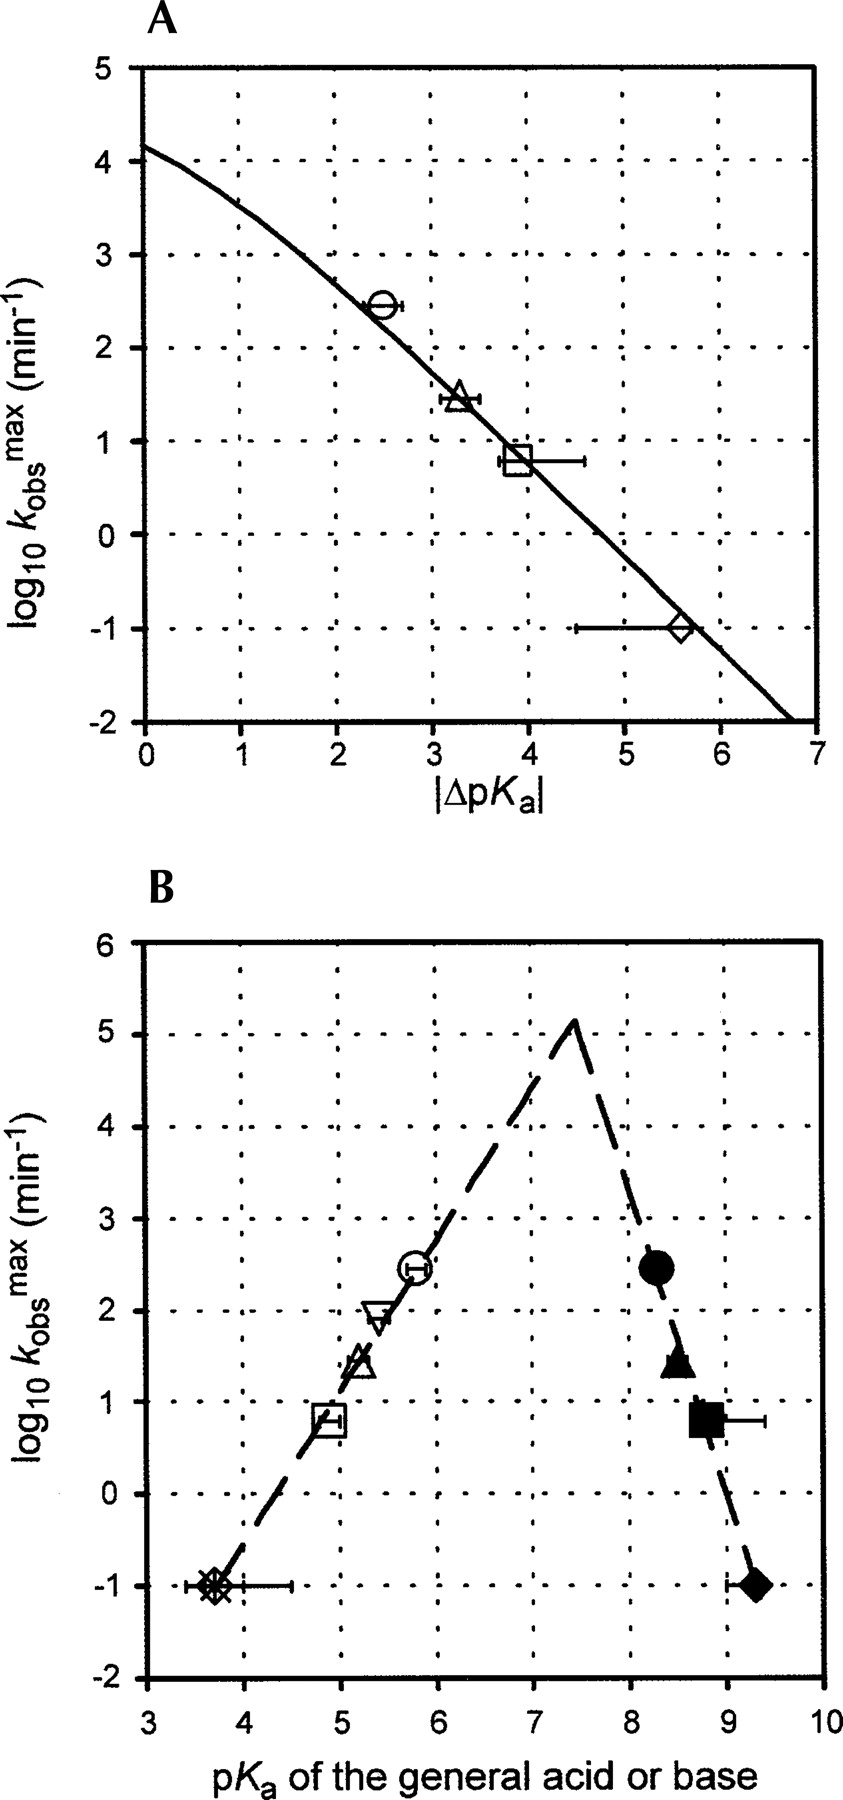
Ionic environment determines the apparent pK a of the general acid and general base and the observed rate of cleavage. (A) The logarithm of the maximal observed rate of cleavage in a given ionic condition, log10kobsmax, is plotted as a function of the absolute value of the difference between pKaA and pKaB (| ΔpKa |). The solid line describes the theoretical relationship between ΔpKa and log10kobsmax for a reaction catalyzed solely by general acid–base catalysis with k1 = 5.8 × 10⁴ min−1 (the mean of the estimates of k1 in the four ionic conditions examined in Fig. 1; see Table 1). Dotted gridlines are included to emphasize the linear relationship between the y- and x-axis variables over most of the pH range. (B) log10kobsmax is plotted as a function of the values of pK aA (open symbols) or pK aB (filled symbols) in Mg2+ (○); Mn2+ (▽); Mg2++Li+ (△); Li+ (□) NH4+ (∗); and Na+ (⋄). Symbols for NH4 + and Na+ lie on top of each other in B. Error bars indicate the upper and lower range of pK a estimates including uncertainties from all sources (see Materials and Methods); error bars in A are the sum of the error bars in B. pK aB could not be experimentally determined for some cations due to oxidation of the metal ion, RNA degradation, or buffering by the metal ion at high pH (see Materials and Methods).




