


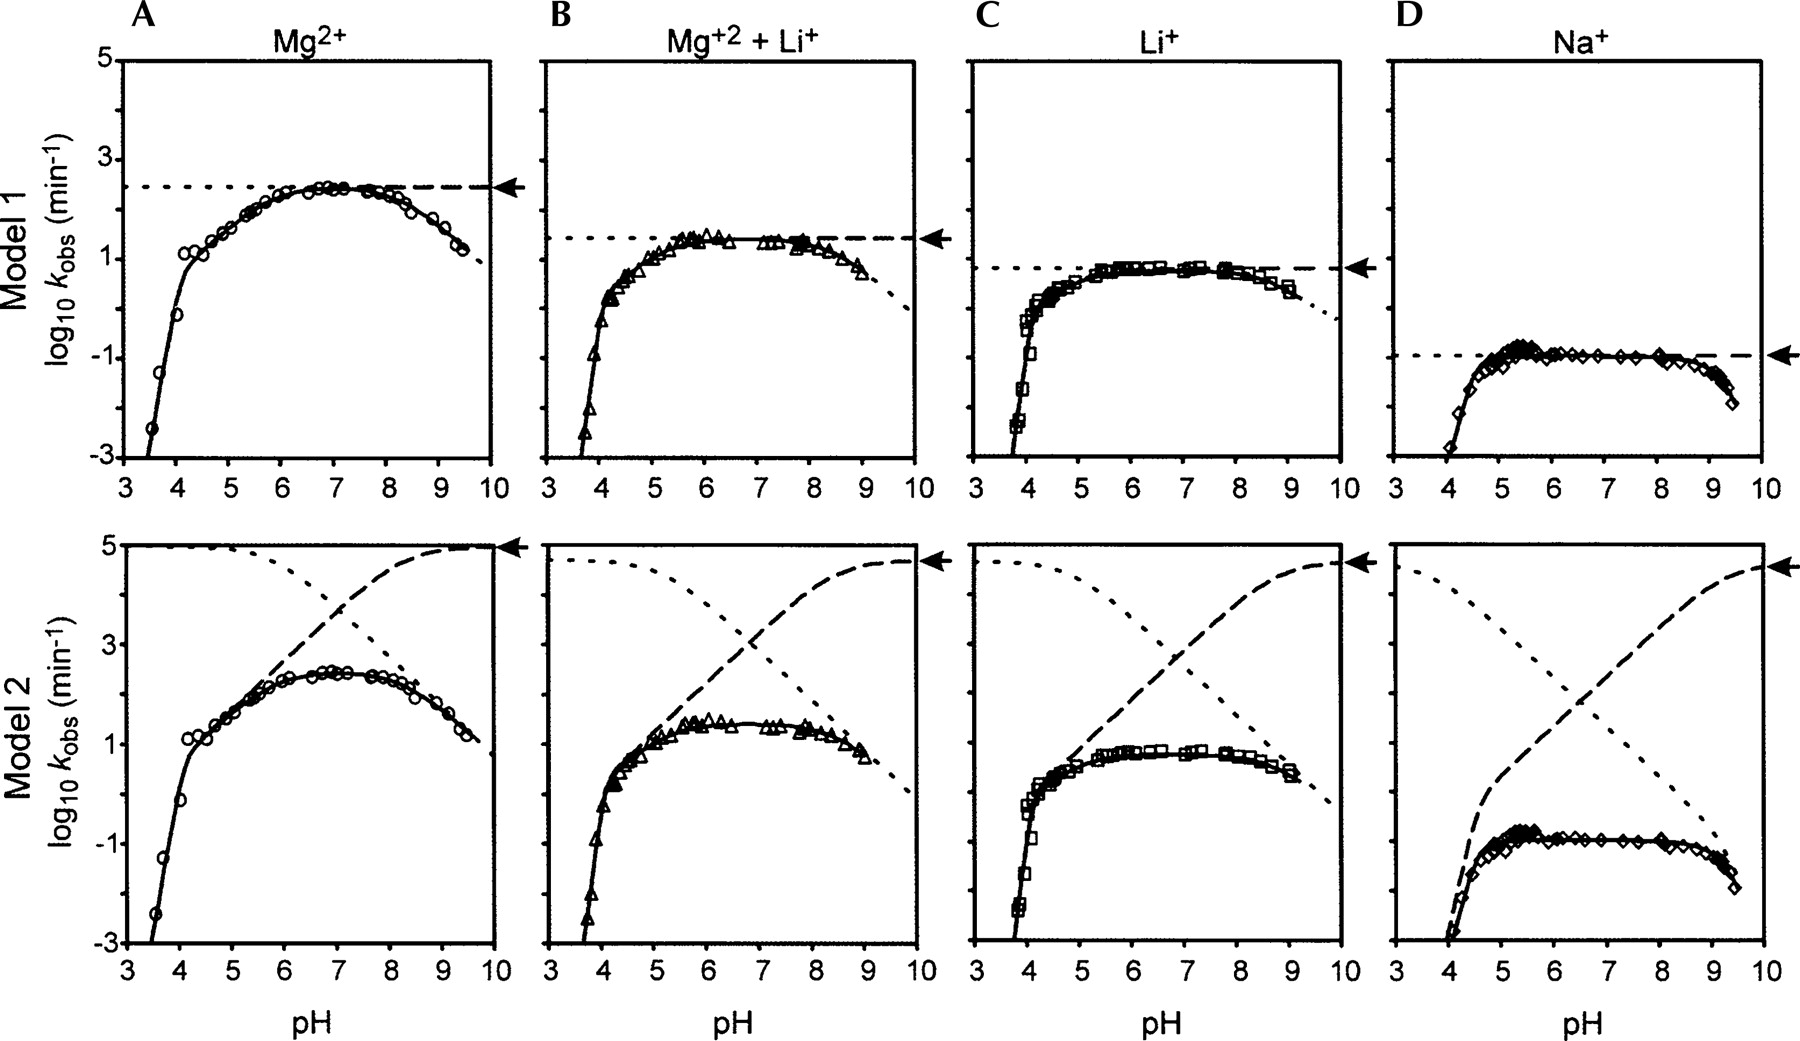
Cleavage rate versus pH curves for the VS ribozyme in different ionic environments. The apparent first-order cleavage rate
constant, k
obs, of the RG version of the VS ribozyme was determined in the presence of the indicated cations over the pH range indicated
(open symbols): (A) 200 mM MgCl2; (B) 2.5 M LiCl + 20 mM MgCl2; (C) 2.5 M LiCl; (D) 2.5 M NaCl. Control experiments showed that the concentrations of cations used were saturating across the pH range examined
(see Materials and Methods). Data were fit to either of two kinetically ambiguous models of general acid–base catalysis that
also included a term describing the cooperative loss of activity at low pH (Jaikaran et al. 2008) (solid lines; see Materials
and Methods). In Model 1, the lower pK
a is assigned to the general base and the higher pKa to the general acid; these assignments are reversed in Model 2. Dotted and dashed lines describe the titration of the general
acid (
 ), and the general base plus the contribution from cooperative loss of activity below pH 4
 respectively, having the pK
a values inferred from the data. The intrinsic rate of the bond-breaking step, k
1, is indicated by the arrows. Parameter values are presented in Table 1.
respectively, having the pK
a values inferred from the data. The intrinsic rate of the bond-breaking step, k
1, is indicated by the arrows. Parameter values are presented in Table 1.




