


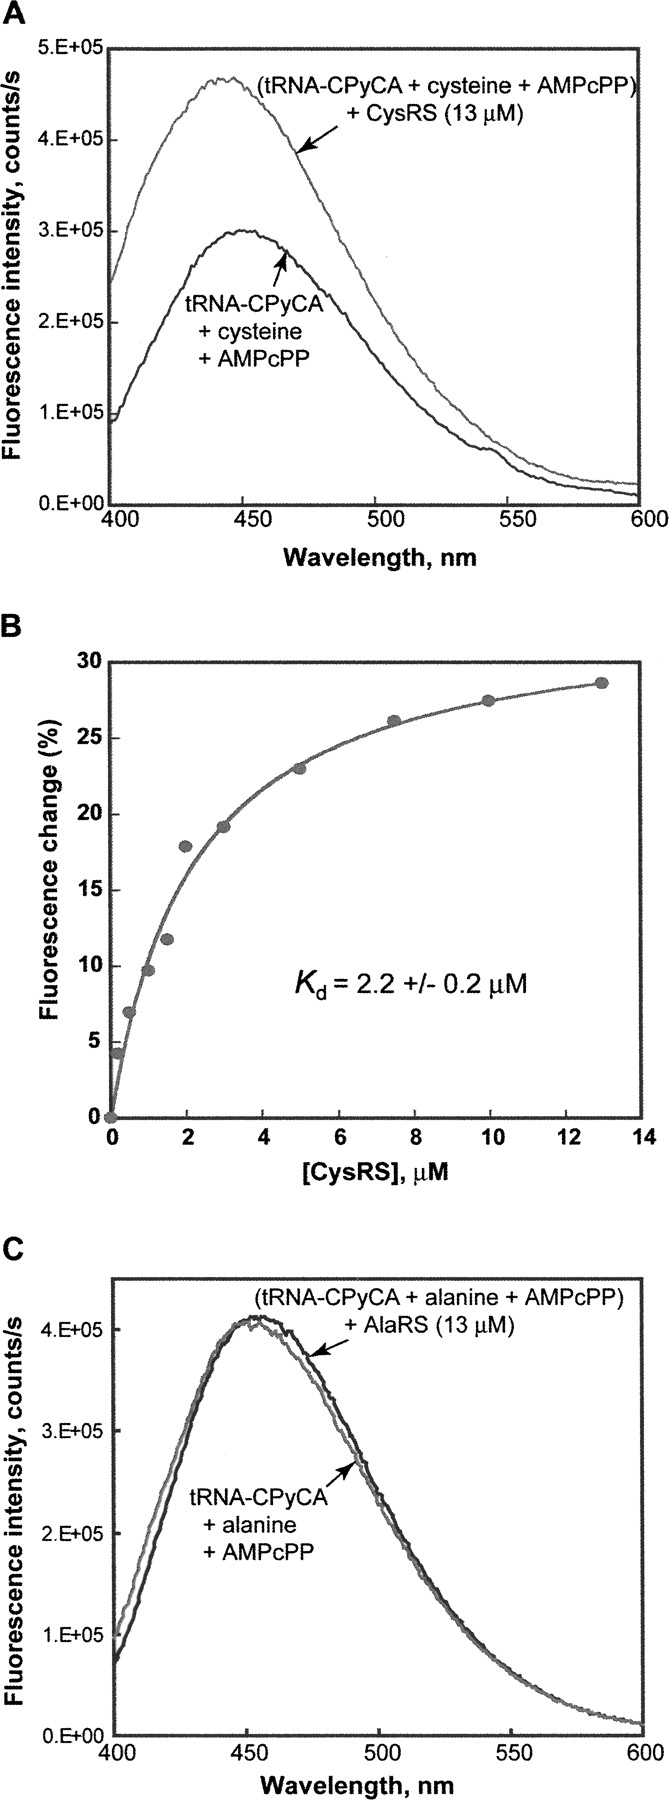
FIGURE 5.
Fluorescence of PyC-labeled E. coli tRNACys. (A) Emission spectrum of E. coli tRNACys-CPyCA (0.1 μM) in the presence of cysteine (0.5 mM) and AMPcPP (1 mM), with and without E. coli CysRS (13 μM). (B) Replot of fluorescence increase of the tRNA upon binding E. coli CysRS as a function of the enzyme concentration and fit to a hyperbolic binding equation to derive the K d of 2.2 ± 0.2 μM. (C) Emission spectrum of E. coli tRNACys-CPyCA (0.1 μM) in the presence of alanine (0.5 mM) and AMPcPP (1 mM), with and without E. coli AlaRS (13 μM).




