


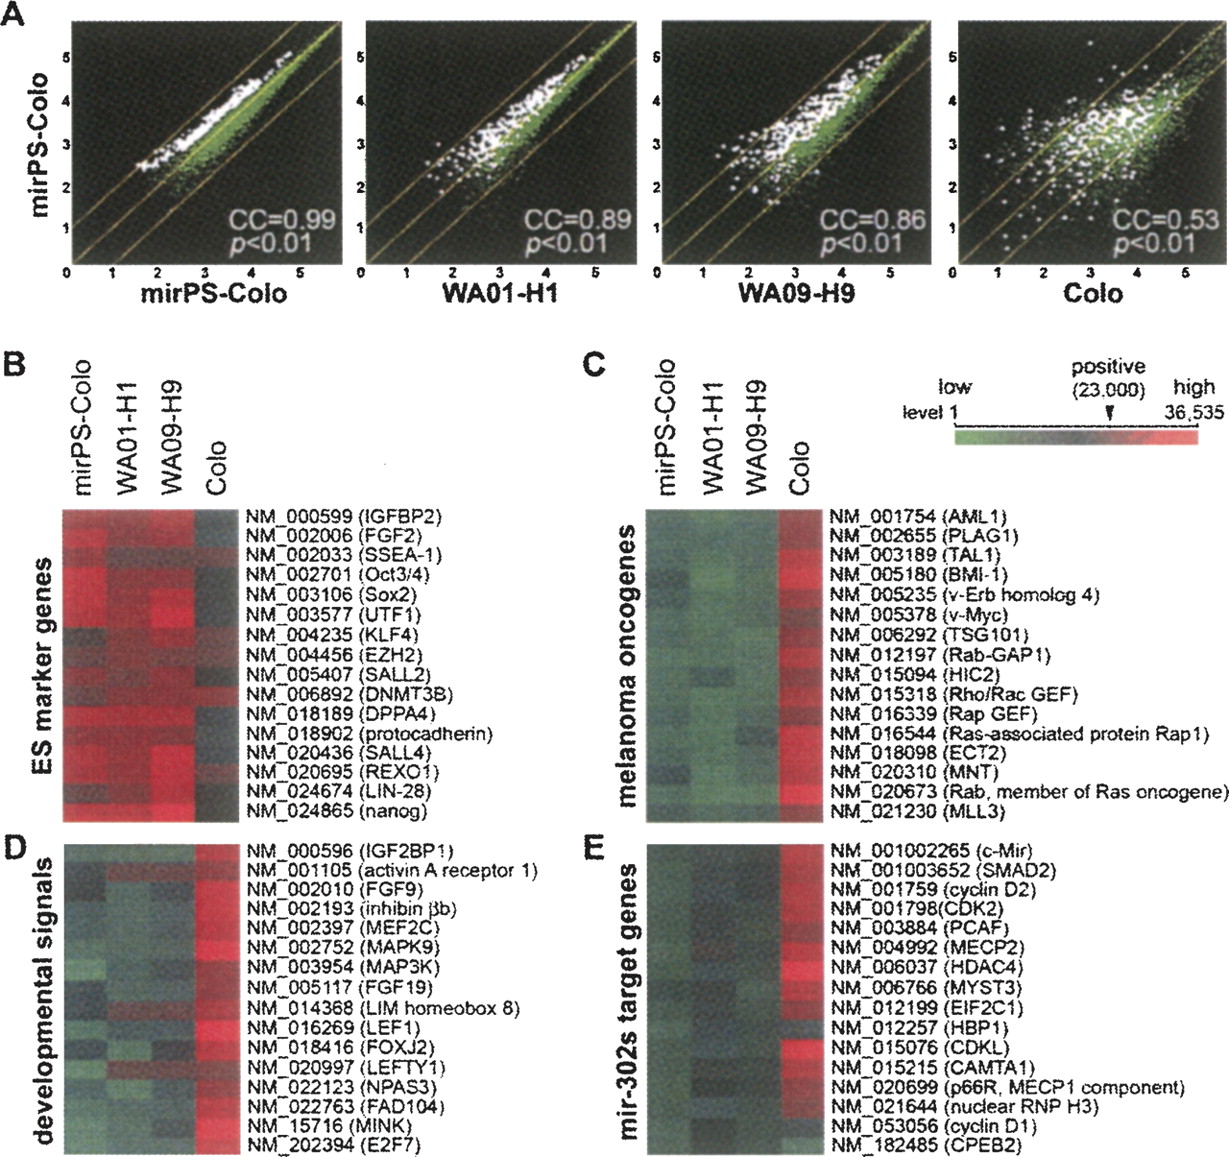
Genome-wide gene expression analyses among Colo, mirPS-Colo, and human ES WA01-H1 (H1) and WA09-H9 (H9) cells. (A) Comparison of altered gene expression patterns using Human genome GeneChip U133A&B and plus 2.0 arrays (Affymetrix), showing high similarity between mirPS-Colo and H1 (89%) as well as H9 (86%), but not original Colo (53%) cells. White dots referred the highly variable genes compared with the stably expressed genes (green dots). (B–E) Functional clustering of microarray-identified differentially expressed genes, demonstrating that a significant increase of ES cell markers (B) and a marked decrease of melanoma oncogenes (C), developmental signals (D), and mir-302s-targeted cell proliferation and DNA methylation genes (E) were detected in mirPS cells, which highly resembled those in H1 and H9 cells (n = 4, P <0.01). Any signal showing above the level 23,000 of a total 36,535 (in red) was considered to be a positive call in the gene expression list. All differential genes shown in C–E were the target genes of mir-302s predicted by the TARGETSCAN and PICTAR-VERT programs.




