


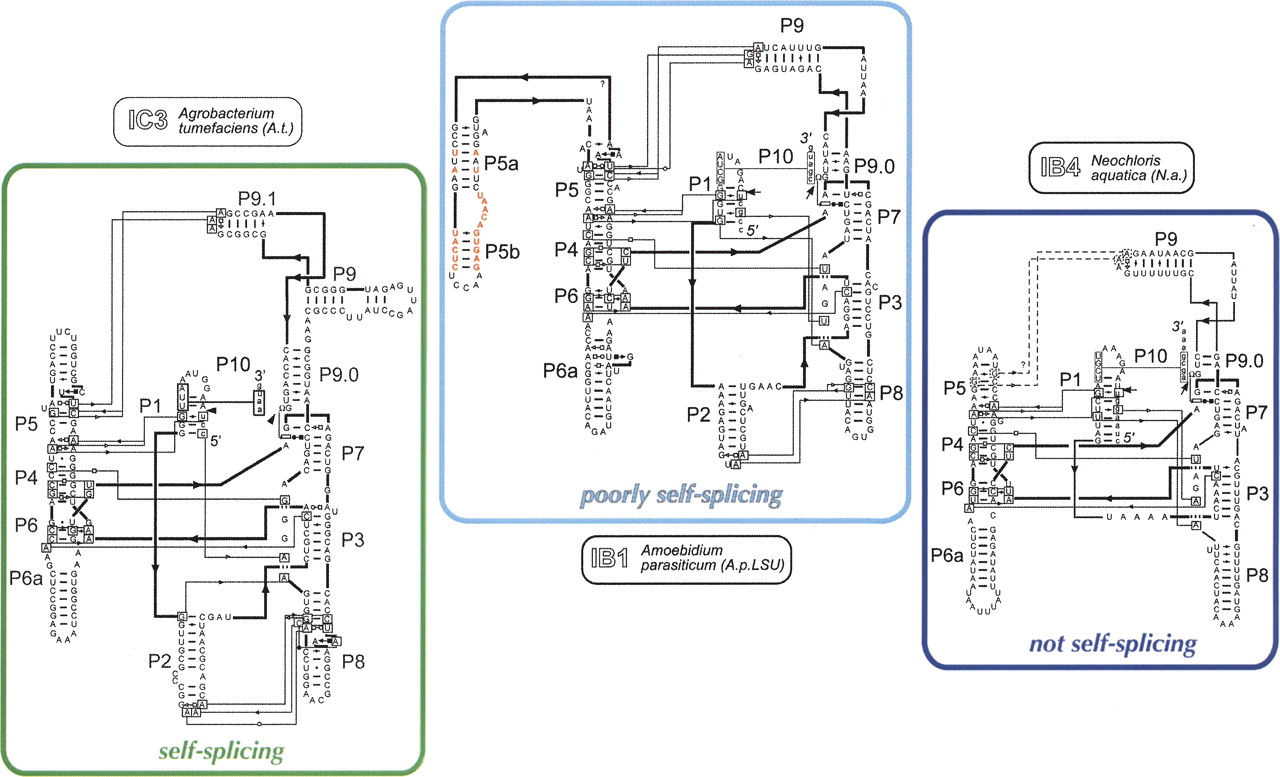
FIGURE 5.
Interaction network diagrams for three representative group I introns. Base pairing within long range interactions and structural motifs is shown using the nomenclature of Leontis and Westhof (2001). Circles denote interactions involving the Watson-Crick face, squares the Hoogsteen face, and triangles the sugar edge. A question mark on the A.p.LSU diagram indicates the ambiguous topology of the J5/5a junction (residues 100% conserved in the P5ab extensions of the A.p.LSU and A.p.SSU introns are shown in red). The self-splicing behavior is indicated in the same color code as in Figure 2.




